Supercharge Kubernetes Networking Observability using Hubble and Cilium
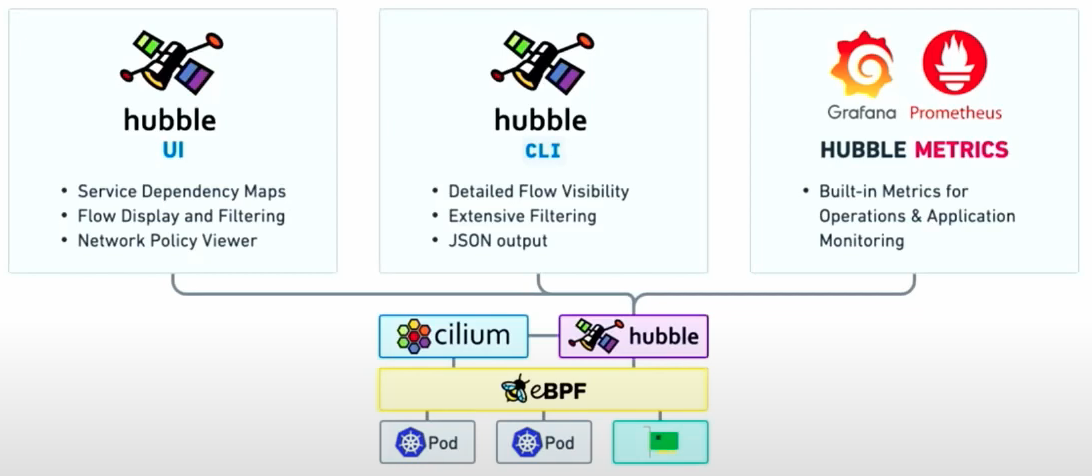
Networking observability in Kubernetes environments is essential for troubleshooting, security, and performance optimization. Hubble, an observability platform for the Cilium CNI, addresses this challenge by providing real-time insights into network traffic, security policies, and application-layer interactions. Hubble is built on eBPF (Extended Berkeley Packet Filter) and provides deep visibility into packet flows, service-to-service communication, and security enforcement without requiring intrusive packet mirroring or modifications to application code. In a nutshell, Hubble is a fully distributed networking and security observability platform for cloud native workloads.
In this introductory blog about Hubble for Cilium, We will start with a real life example highlighting where traditional monitoring tools fall short. We will then look at how Hubble + Cilium can address these gaps. In the second blog, I will describe how Rafay provides our customers with a a tight, turnkey integration with Cilium for various cluster types (i.e. Rafay MKS for Data Centers and Public Cloud Distributions such as Amazon EKS).
Why Traditional Tools Fall Short?
Traditional monitoring tools for Kubernetes such as Prometheus or Datadog are widely used for observability. But, they often struggle to provide deep network visibility in Kubernetes environments. Let us look at a real life example to understand this better.
Consider a scenario where the Ops team and Developers have to debug a microservices connectivity issue for an e-commerce application that they deploy and operate on Kubernetes. The end users are complaining that they can’t complete purchases. The logs for the frontend service shows that API calls to the payment service are timing out.
Here's how Ops would attempt to troubleshoot using traditional monitoring:
Step 1: Check Service Logs
The engineers inspect logs and find HTTP 504 Gateway Timeout errors from the frontend. But, the logs don’t show why requests to the payment service are failing.
Step 2: Monitor Service Metrics
Prometheus metrics indicate that the payment service is healthy and CPU/memory usage is normal. However, there are no clear insights into network flows or dropped connections.
Step 3: Manual Debugging & Tracing
Frustrated because there are no insights, the engineers attempt to trace requests using OpenTelemetry but find that traces stop at the frontend. There is no indication of where in the network the failure is occurring.
Step 4: Low Level Tools
The engineers now resort to using kubectl describe and kubectl logs. They also check pod events and logs. But, these reveal no crashes or errors on the payment service. Essentially, no information is available about dropped packets or policy violations.
How would Hubble with Cilium help with this scenario?
Traditional monitoring tools are great for logs, metrics, and application tracing, but they lack real-time Kubernetes network observability. Hubble, with its eBPF-powered insights, provides immediate visibility into network flows, dropped packets, and security policies—making it the best tool for debugging Kubernetes networking issues.
For the example above, the engineer would use Hubble to inspect network flows. Specifically, they would have immediately noticed that packets from the frontend to payment service were being dropped due to a misconfigured Kubernetes Network Policy. They would have quickly updated the misconfigured network policy to allow frontend traffic to the payment service and the issue would have been resolved in minutes without guesswork or using multiple tools.
Key Use Cases for Hubble
The key use cases for Hubble are:
1. Network Troubleshooting & Flow Analysis
Hubble allows users to observe real-time pod-to-pod and service-to-service communication, making it easy to debug connectivity issues. Whether a microservice is experiencing unexpected traffic patterns or a service is unreachable, Hubble provides flow logs and packet insights to diagnose and resolve issues.
For example, a developer notices that a newly deployed service isn't receiving traffic. Using hubble observe, they can trace network flows and identify whether the issue is a misconfigured Kubernetes NetworkPolicy or a DNS resolution problem.
2. Security & Policy Enforcement Monitoring
Hubble integrates with Cilium Network Policies to provide visibility into security rule enforcement. This is critical for ensuring compliance with zero-trust security models and detecting unauthorized traffic.
For example, a security engineer wants to verify if all external API calls comply with security policies. Hubble can display logs showing whether traffic is blocked or allowed based on Cilium rules, helping to refine access controls and detect potential policy bypasses.
3. Application Layer (L7) Observability
Unlike traditional monitoring tools that focus only on Layer-3 (IP) and Layer-4 (TCP/UDP) traffic, Hubble provides deep visibility into Layer-7 protocols (HTTP, gRPC, DNS, Kafka, etc.). This is particularly useful for API-heavy applications.
For example, a SRE needs to analyze HTTP request latency between services. With Hubble, they can inspect request paths, response statuses, and failure rates, helping optimize API performance and identify slow microservices.
4. Performance Optimization & Latency Analysis
By monitoring service-to-service latency, Hubble helps teams identify bottlenecks in distributed applications. This enables fine-tuning of networking parameters, load balancing, and infrastructure scaling.
For example, a DevOps team deploying a high-traffic e-commerce platform notices latency spikes. Using Hubble, they can pinpoint which services have high network latency or excessive retries, allowing them to adjust configurations or scale resources appropriately.
Conclusion
The table below provides a concise summary of the benefits of Hubble + Cilium based observability over a traditional monitoring stack. In a follow-on blog, I will describe how Rafay provides our customers with a a tight, turnkey integration with Cilium for various cluster types (i.e. Rafay MKS for Data Centers and Public Cloud Distributions such as Amazon EKS). My colleague will follow up another blog describing how customers can easily deploy and use Hubble with Cilium on clusters managed by the Rafay Platform.
| Capability | Traditional Monitoring (Prometheus/ELK) | Hubble (Cilium-based) |
|---|---|---|
| Network Flow Visibility | Limited (No pod-to-pod tracing) | ✅ Full L3/L4/L7 visibility |
| Security Policy Debugging | No direct insights | ✅ Identifies policy violations |
| Packet Drop Detection | Not available | ✅ Shows dropped packets in real-time |
| Service-to-Service Comms | Needs external tracing tools | ✅ Built-in flow tracing |
| Root Cause Analysis | Requires multiple tools | ✅ One command (hubble observe) |
-
Free Org
Sign up for a free Org if you want to try this yourself with our Get Started guides.
-
 Live Demo
Schedule time with us to watch a demo in action.