Visibility
Cost Overview - Introduction
Cost Overview dashboards provide visibility and insights into various metrics generated at cluster/project level. They provide a bird’s eye view of costs and efficiencies for Projects, Clusters and Namespaces. Access is controlled by assigned role. Longer-term retention of historical cost information makes it possible to anticipate future expenses.
Getting to the Dashboards - Cost Overview
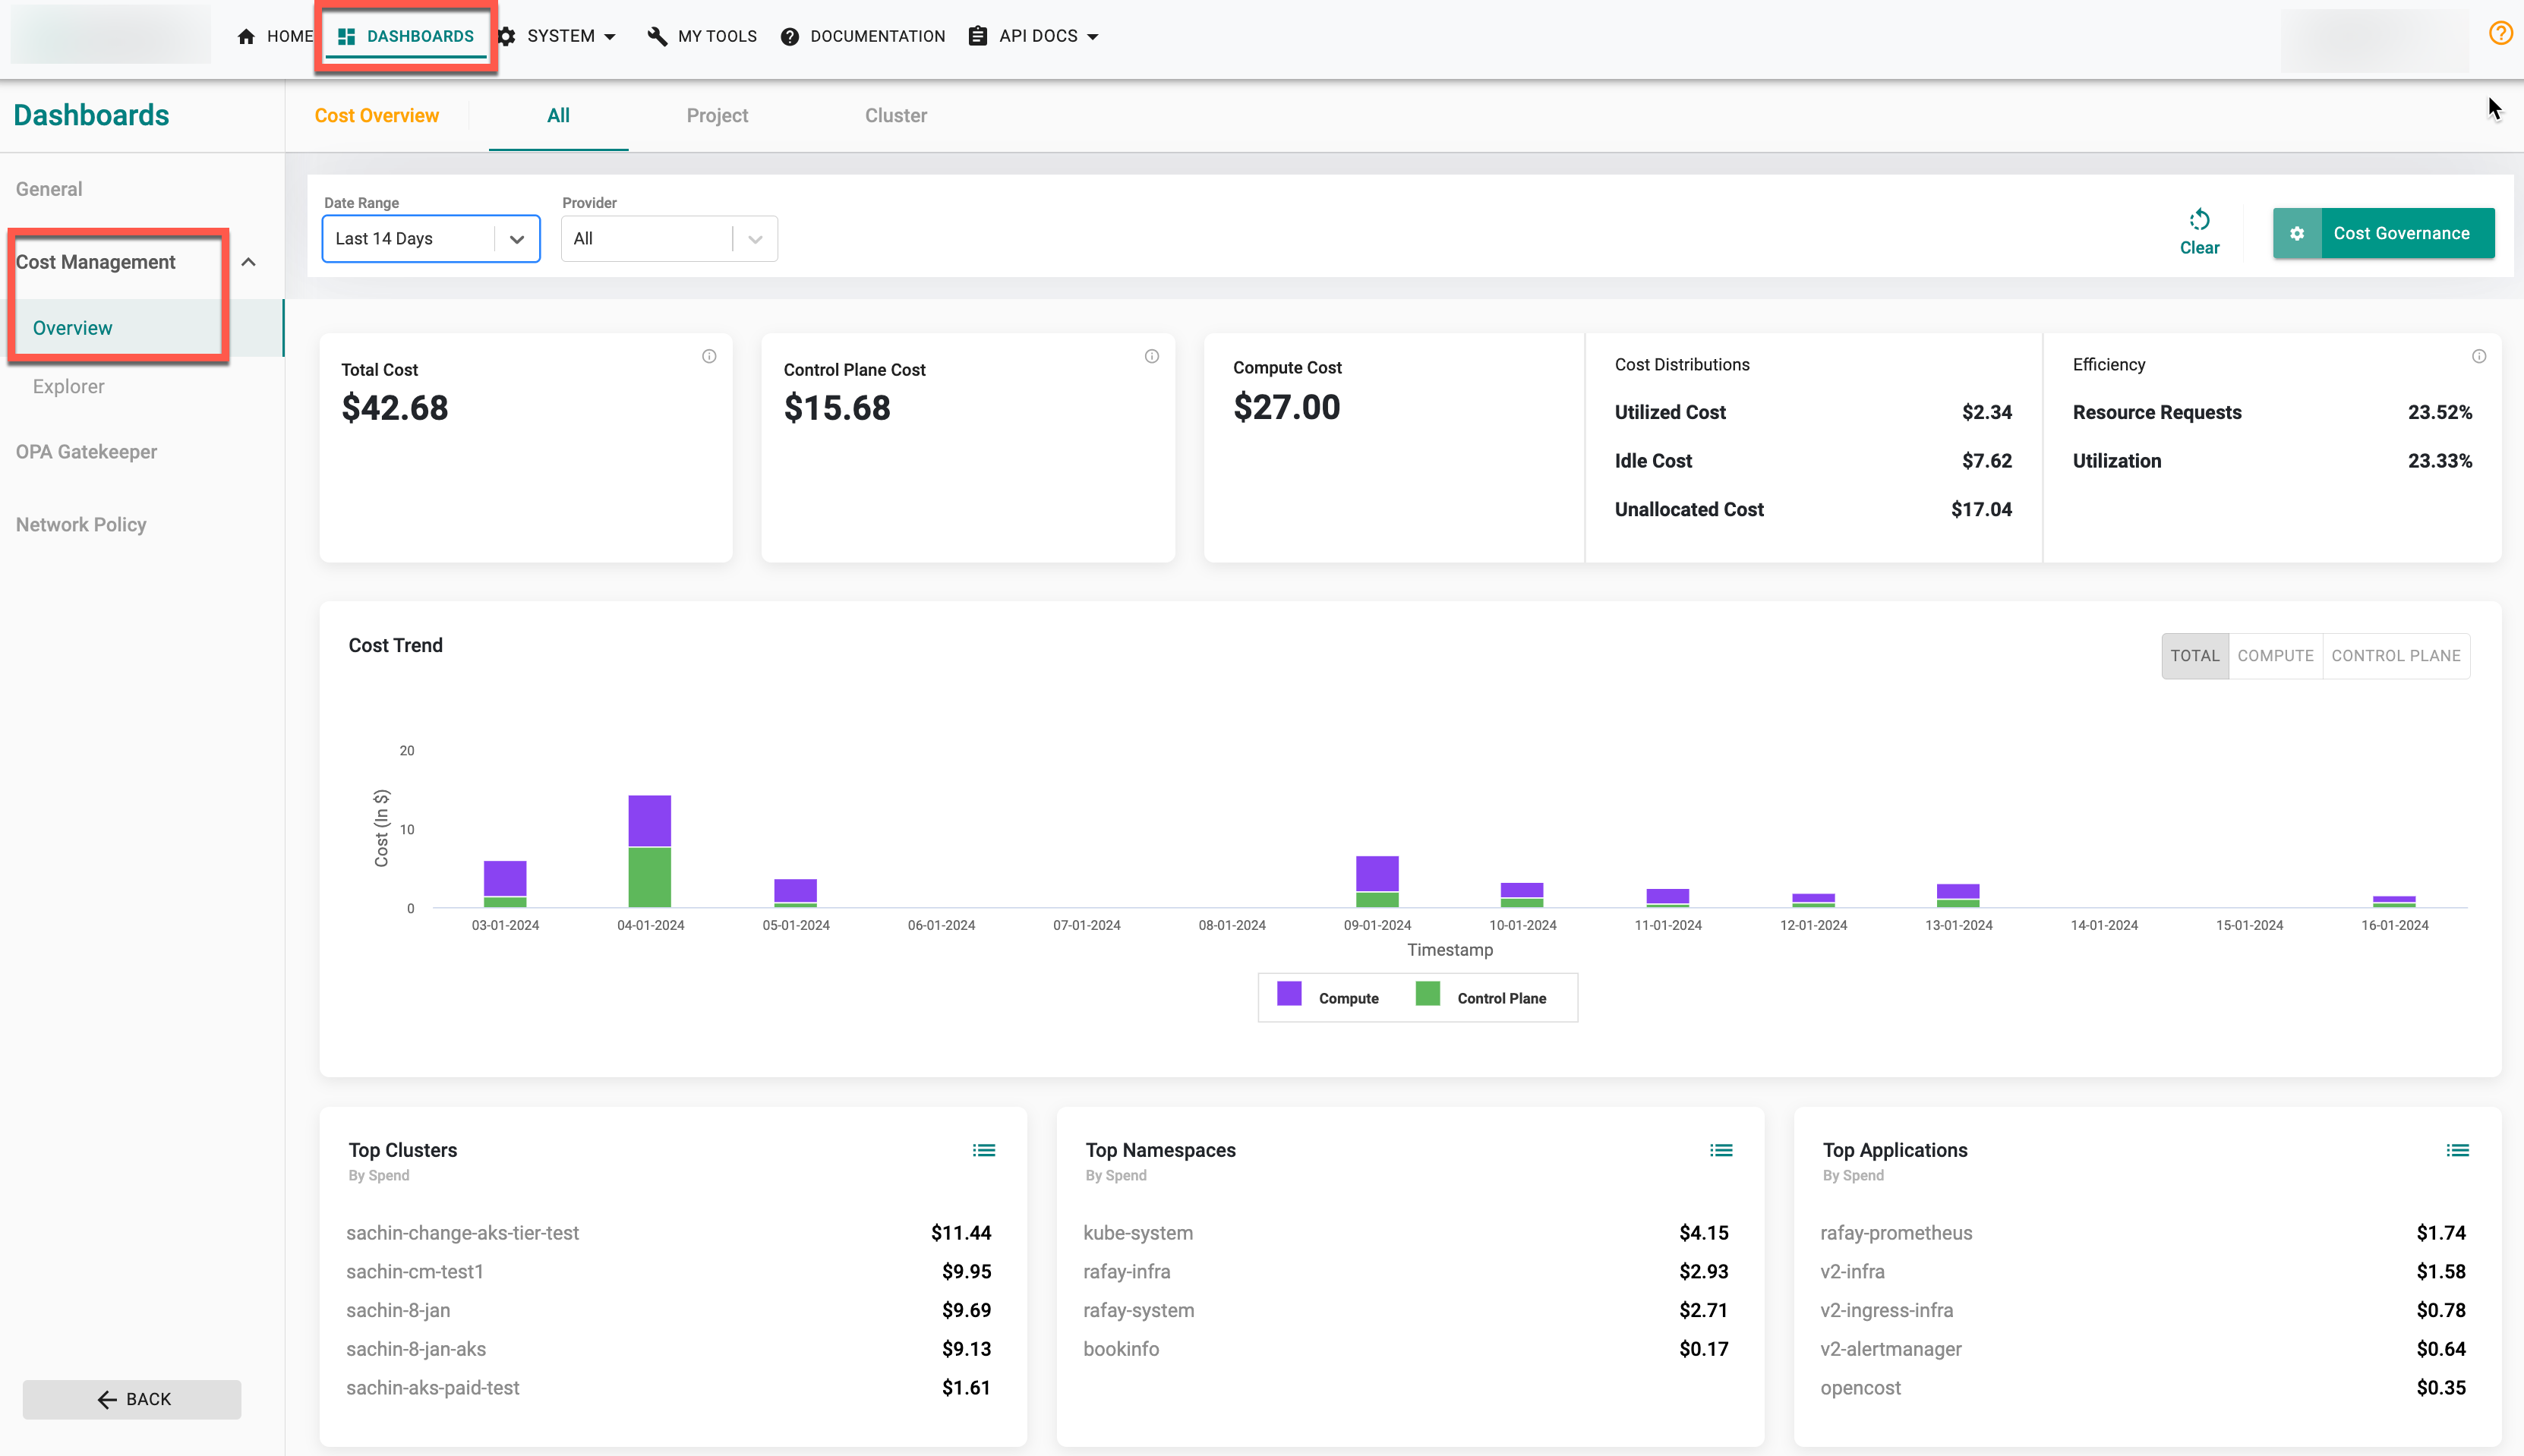
The Cost Overview dashboard card shows resource cost summary and a trend graph, which is helpful to view service provider vs utilization costs
- Login to the controller and click on dashboards
- Select Cost Management and click Overview
-
Use the appropriate tabs to view the cost metrics
- All tab shows a central view of the cost metrics across all projects and clusters
- Project tab shows the cost metrics at a project level
- Cluster tab shows the cost metrics at a cluster level
-
Use the Date filter to view the metrics on different durations (24 hours, 7 days and 14 days). By default, 24 hours data are presented.
- Use the Clear icon to refresh and get back to the default (24 hours) page
Mouse hover on the tooltip (i) of each cost widget to know more about the metrics.
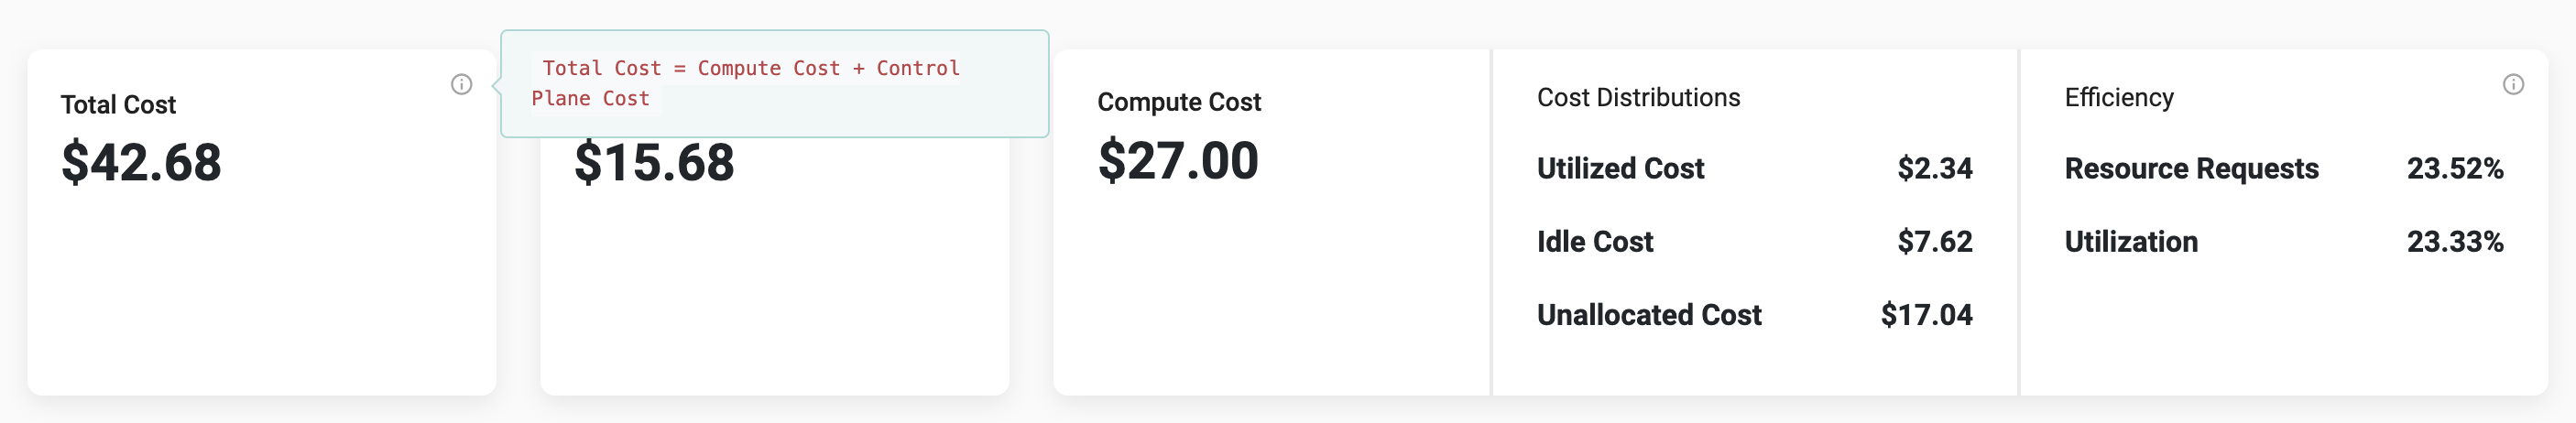
Widgets
- Total cost: Compute cost + Control Plane Cost
- Control Plane Cost: Control Plane Cost is the respective Provider's Cluster Management Fee
- Compute Cost: The overall expense linked to each machine, encompassing utilized cost (resources actively in use), idle cost (associated with inactive resources), and unallocated cost (resources not assigned). Compute cost is the sum of utilized cost, idle cost, and unallocated cost
- Cost Distributions: Shows the cost of Utilized, Idle, and Unallocated resources
- Utilized Cost:: Cost of resources actively utilized
- Idle Cost:: Cost of resources that were allocated based on resource requests but not utilized, Idle cost = Allocated cost - Utilized cost
- Unallocated cost: Cost of resources that are not allocated
- Efficiency:
- Resource Requests: Provides insights into the allocation of resources concerning both utilized and idle costs. Resource Requests = (Utilized Cost / (Utilized Cost + Idle Cost)) * 100
- Utilization: Gives a percentage indicating how efficiently the compute resources are being utilized, considering both costs. Utilization = ((Utilized Cost + Idle Cost) / Compute Cost) * 100
Note: Control plane cost for AKS clusters is not supported for imported clusters that are not managed. Additionally, the cost profile used for AKS clusters should be a custom cost profile exclusively
Cost Trend Legend
Cost Trend has a graphical representation to show the trend of different cost. A legend is presented at the bottom of the graph with different colors to identify the cost type costs. Select the cost (Total, Compute, Control Plane) available in the right corner to view the cost metrics of a specific cost type. Mouse hover on the graph to know the detailed cost metrics for each hour
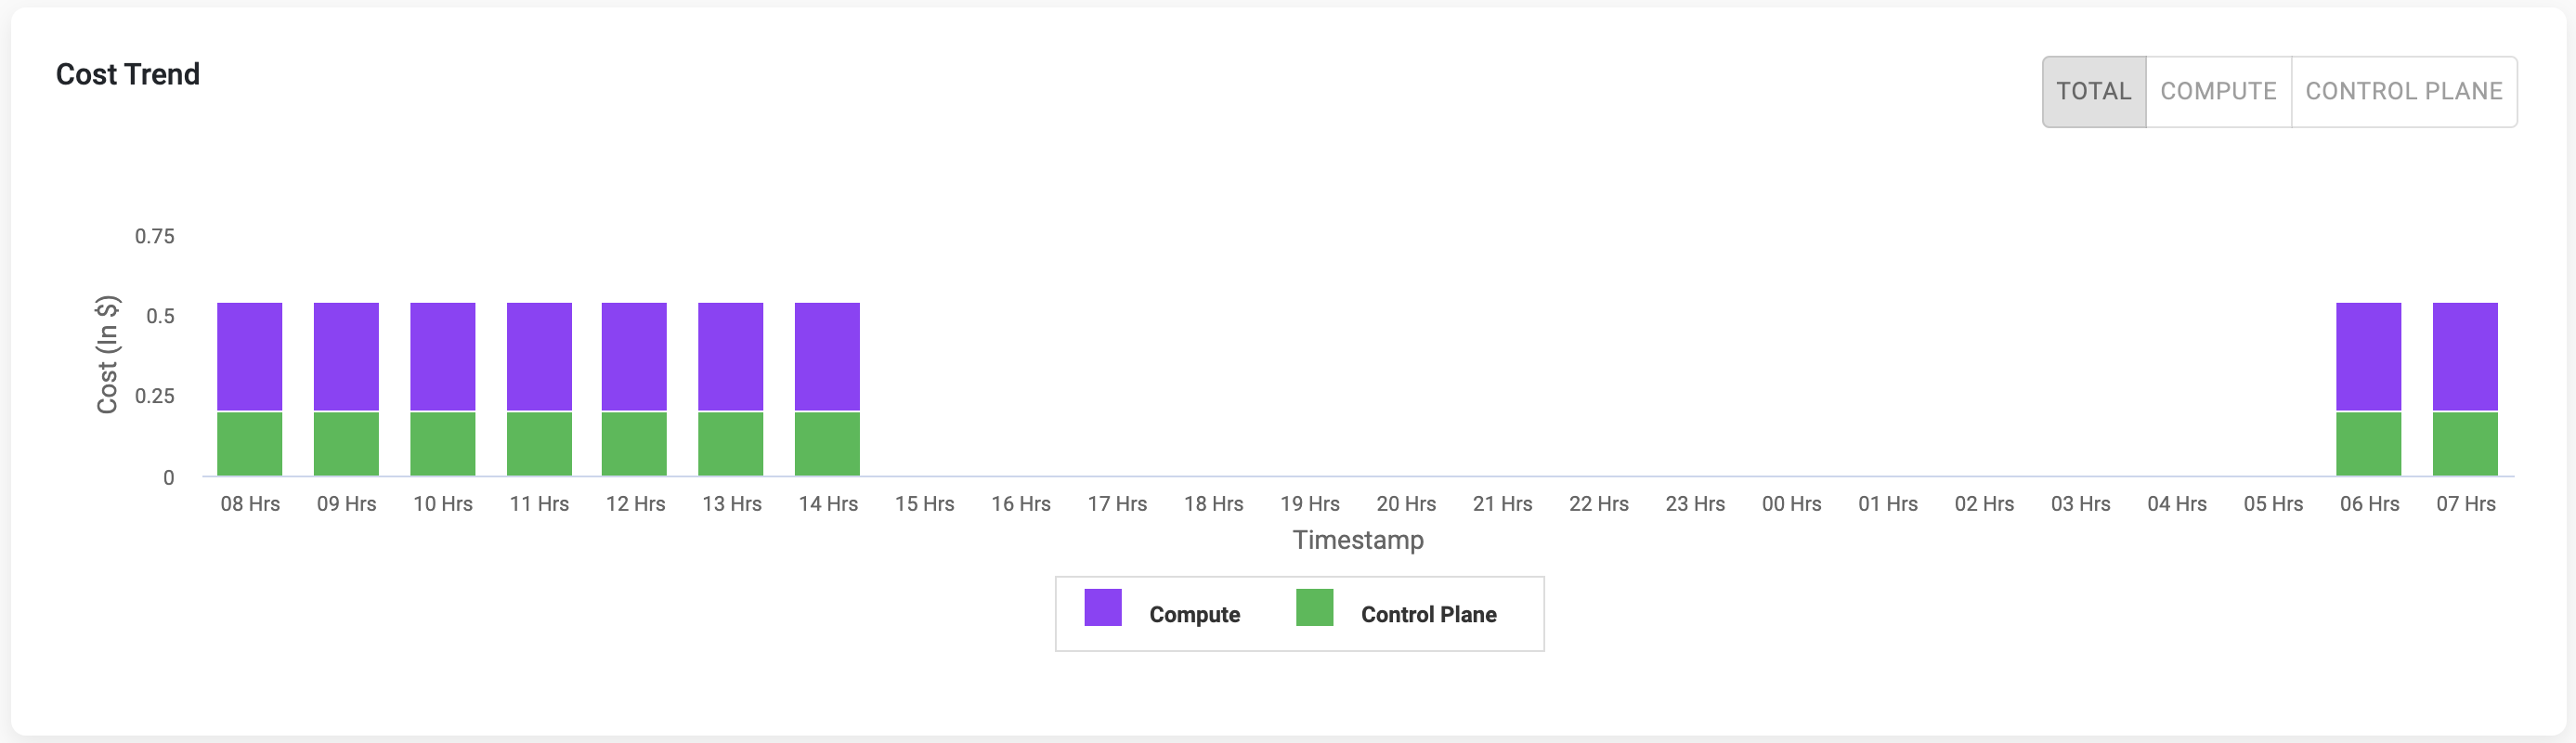
Based on the provider selection, the cost trend differs.
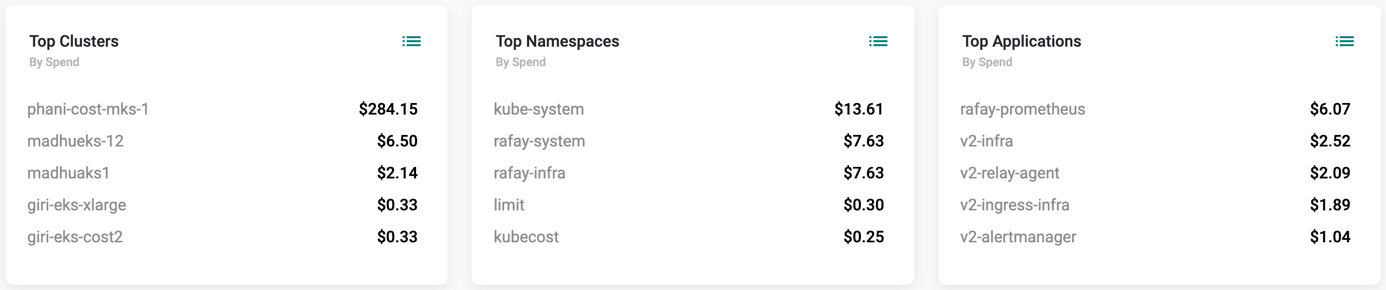
Top Resources
- Top Clusters: Shows the top 5 clusters that consume the highest cost
- Top Namespaces: Shows the top 5 Namespaces that consume the highest cost
- Top Applications: Shows the top 5 Namespaces that consume the highest cost
Click the ellipsis icon against each widget to view all the available clusters, namespaces, and applications along with the cost
Project Level Cost Metrics
Select the Project tab to view the cost of metrics at project level. Select the required project from the drop-down and here you can view the cost details of all the clusters available within the selected project
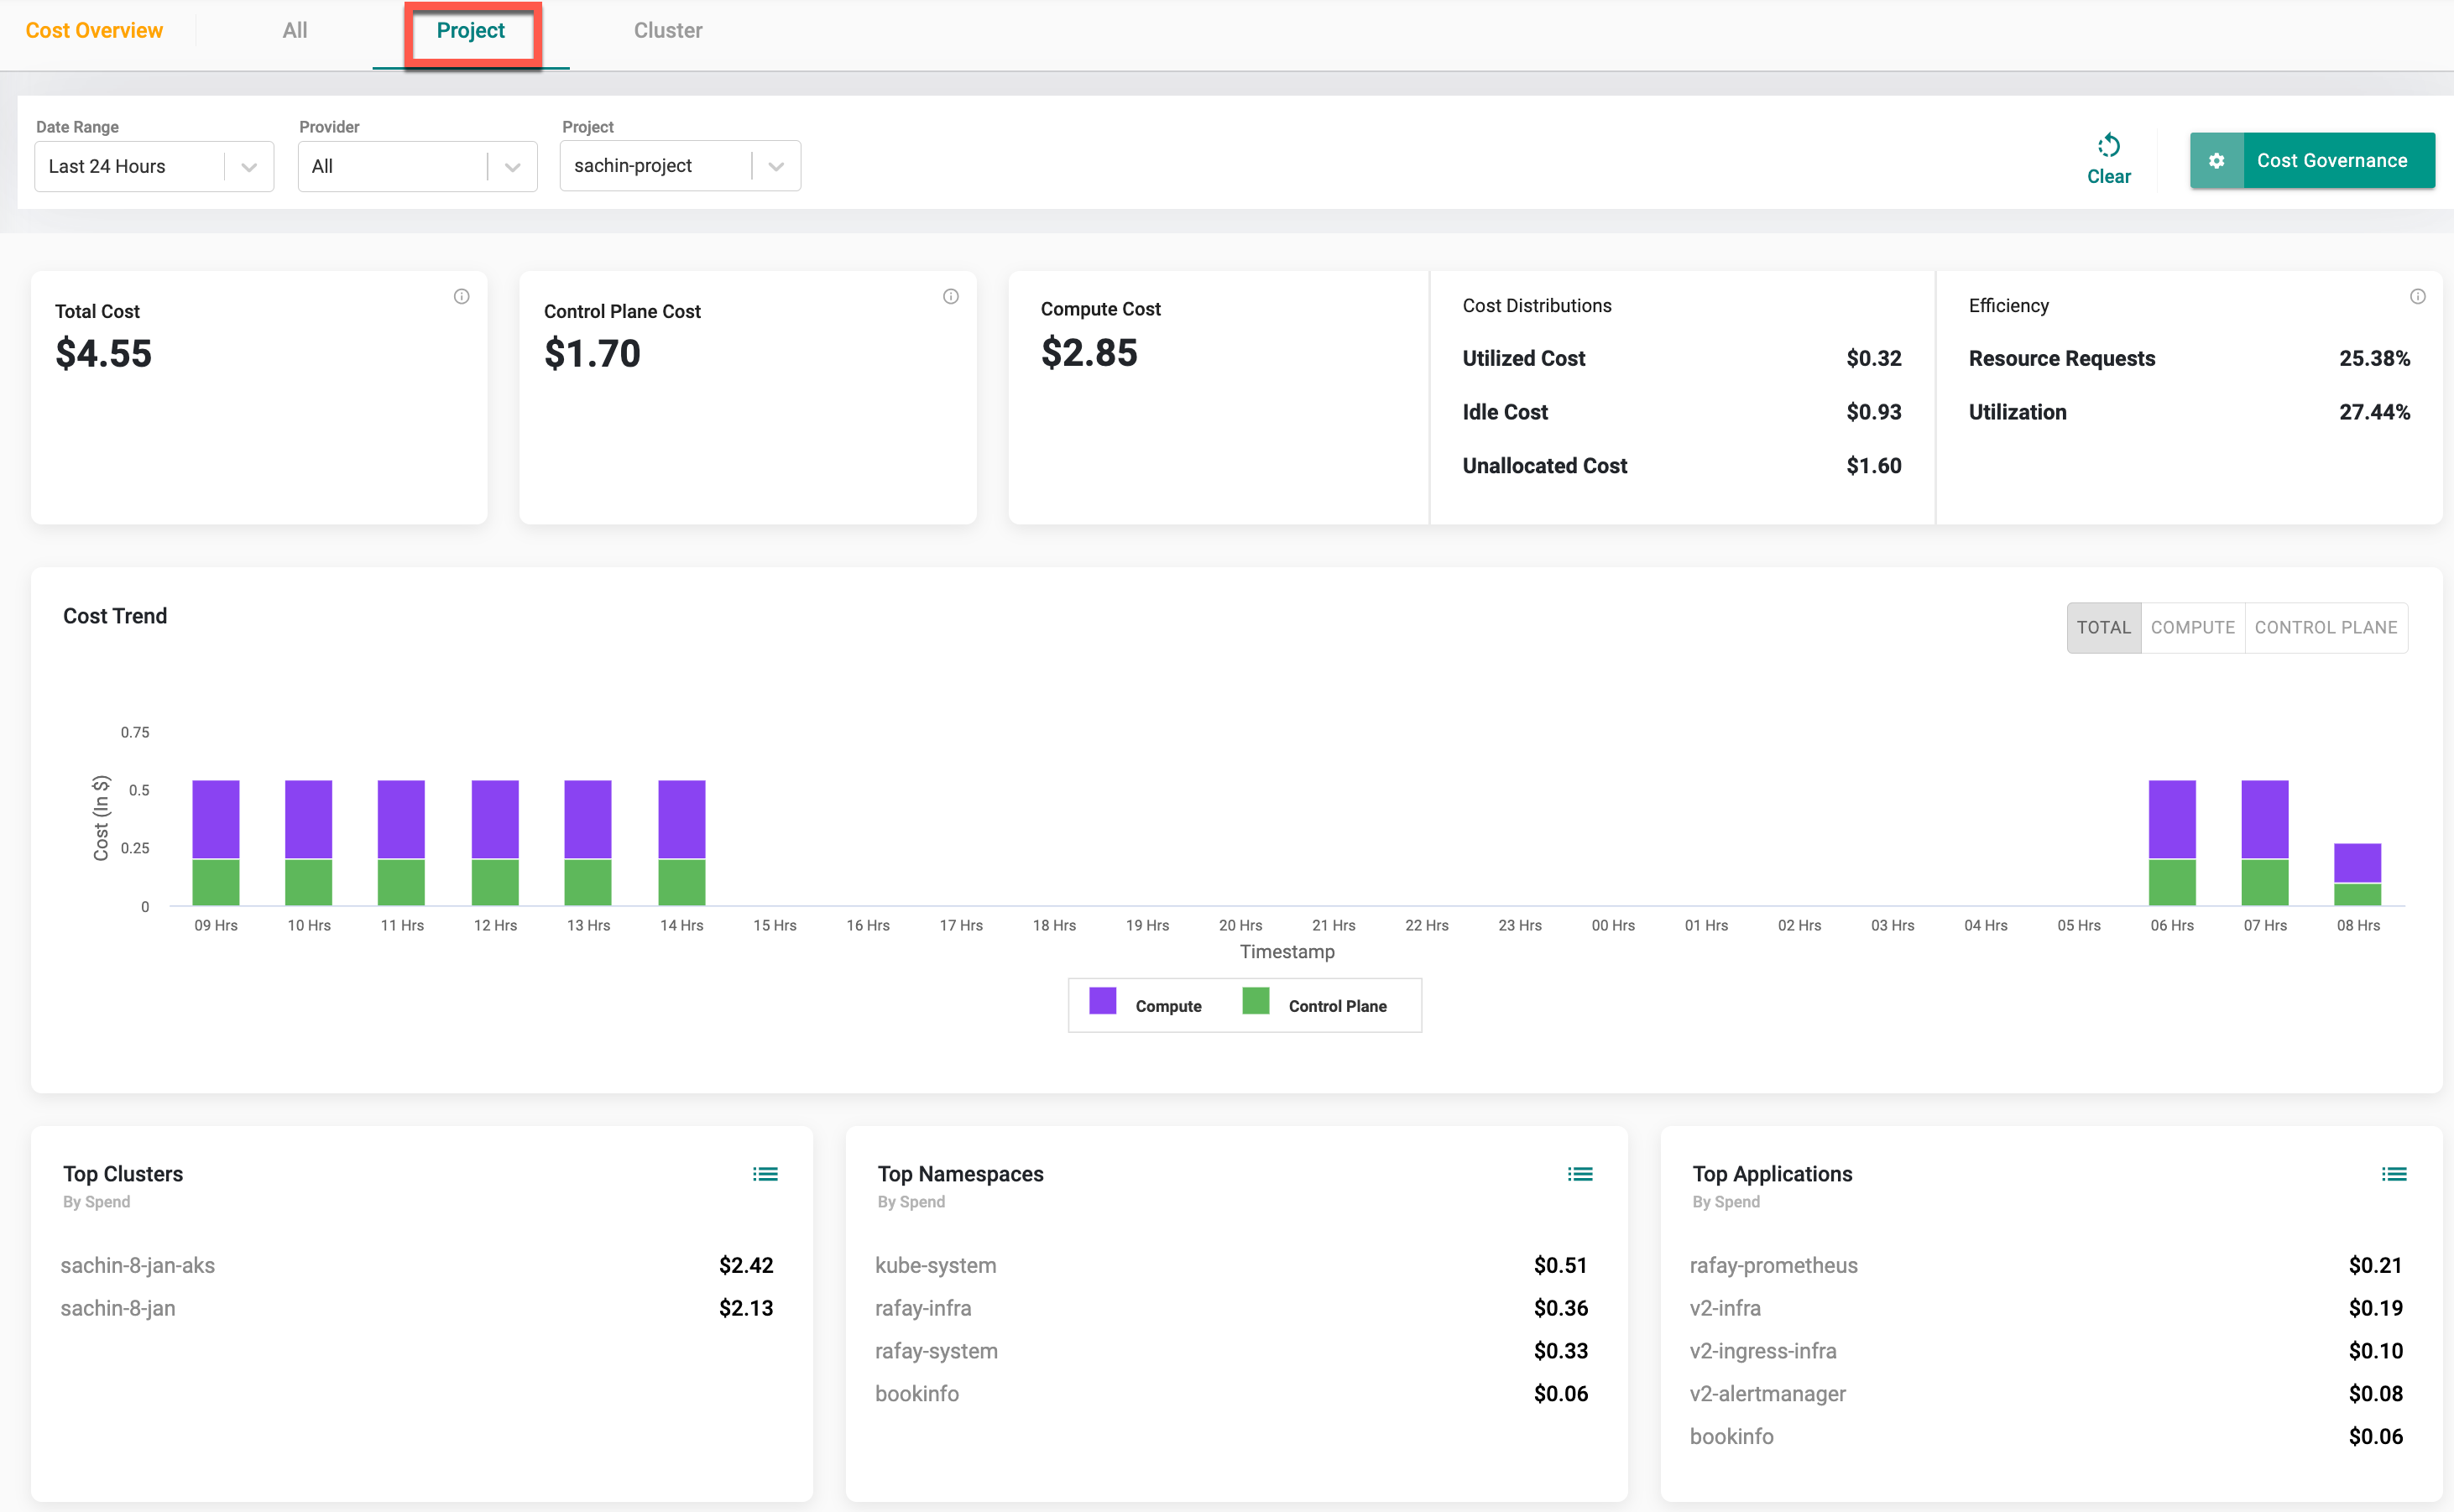
The Unallocated Cost will be empty if the selected project is not the parent project for any clusters.
Cluster Level Cost Metrics
Select the Clusters tab to view the cost of metrics at cluster level. Select the required Provider, Project and Cluster from the drop-down and here you can view the cost details of all the clusters available within the selected project
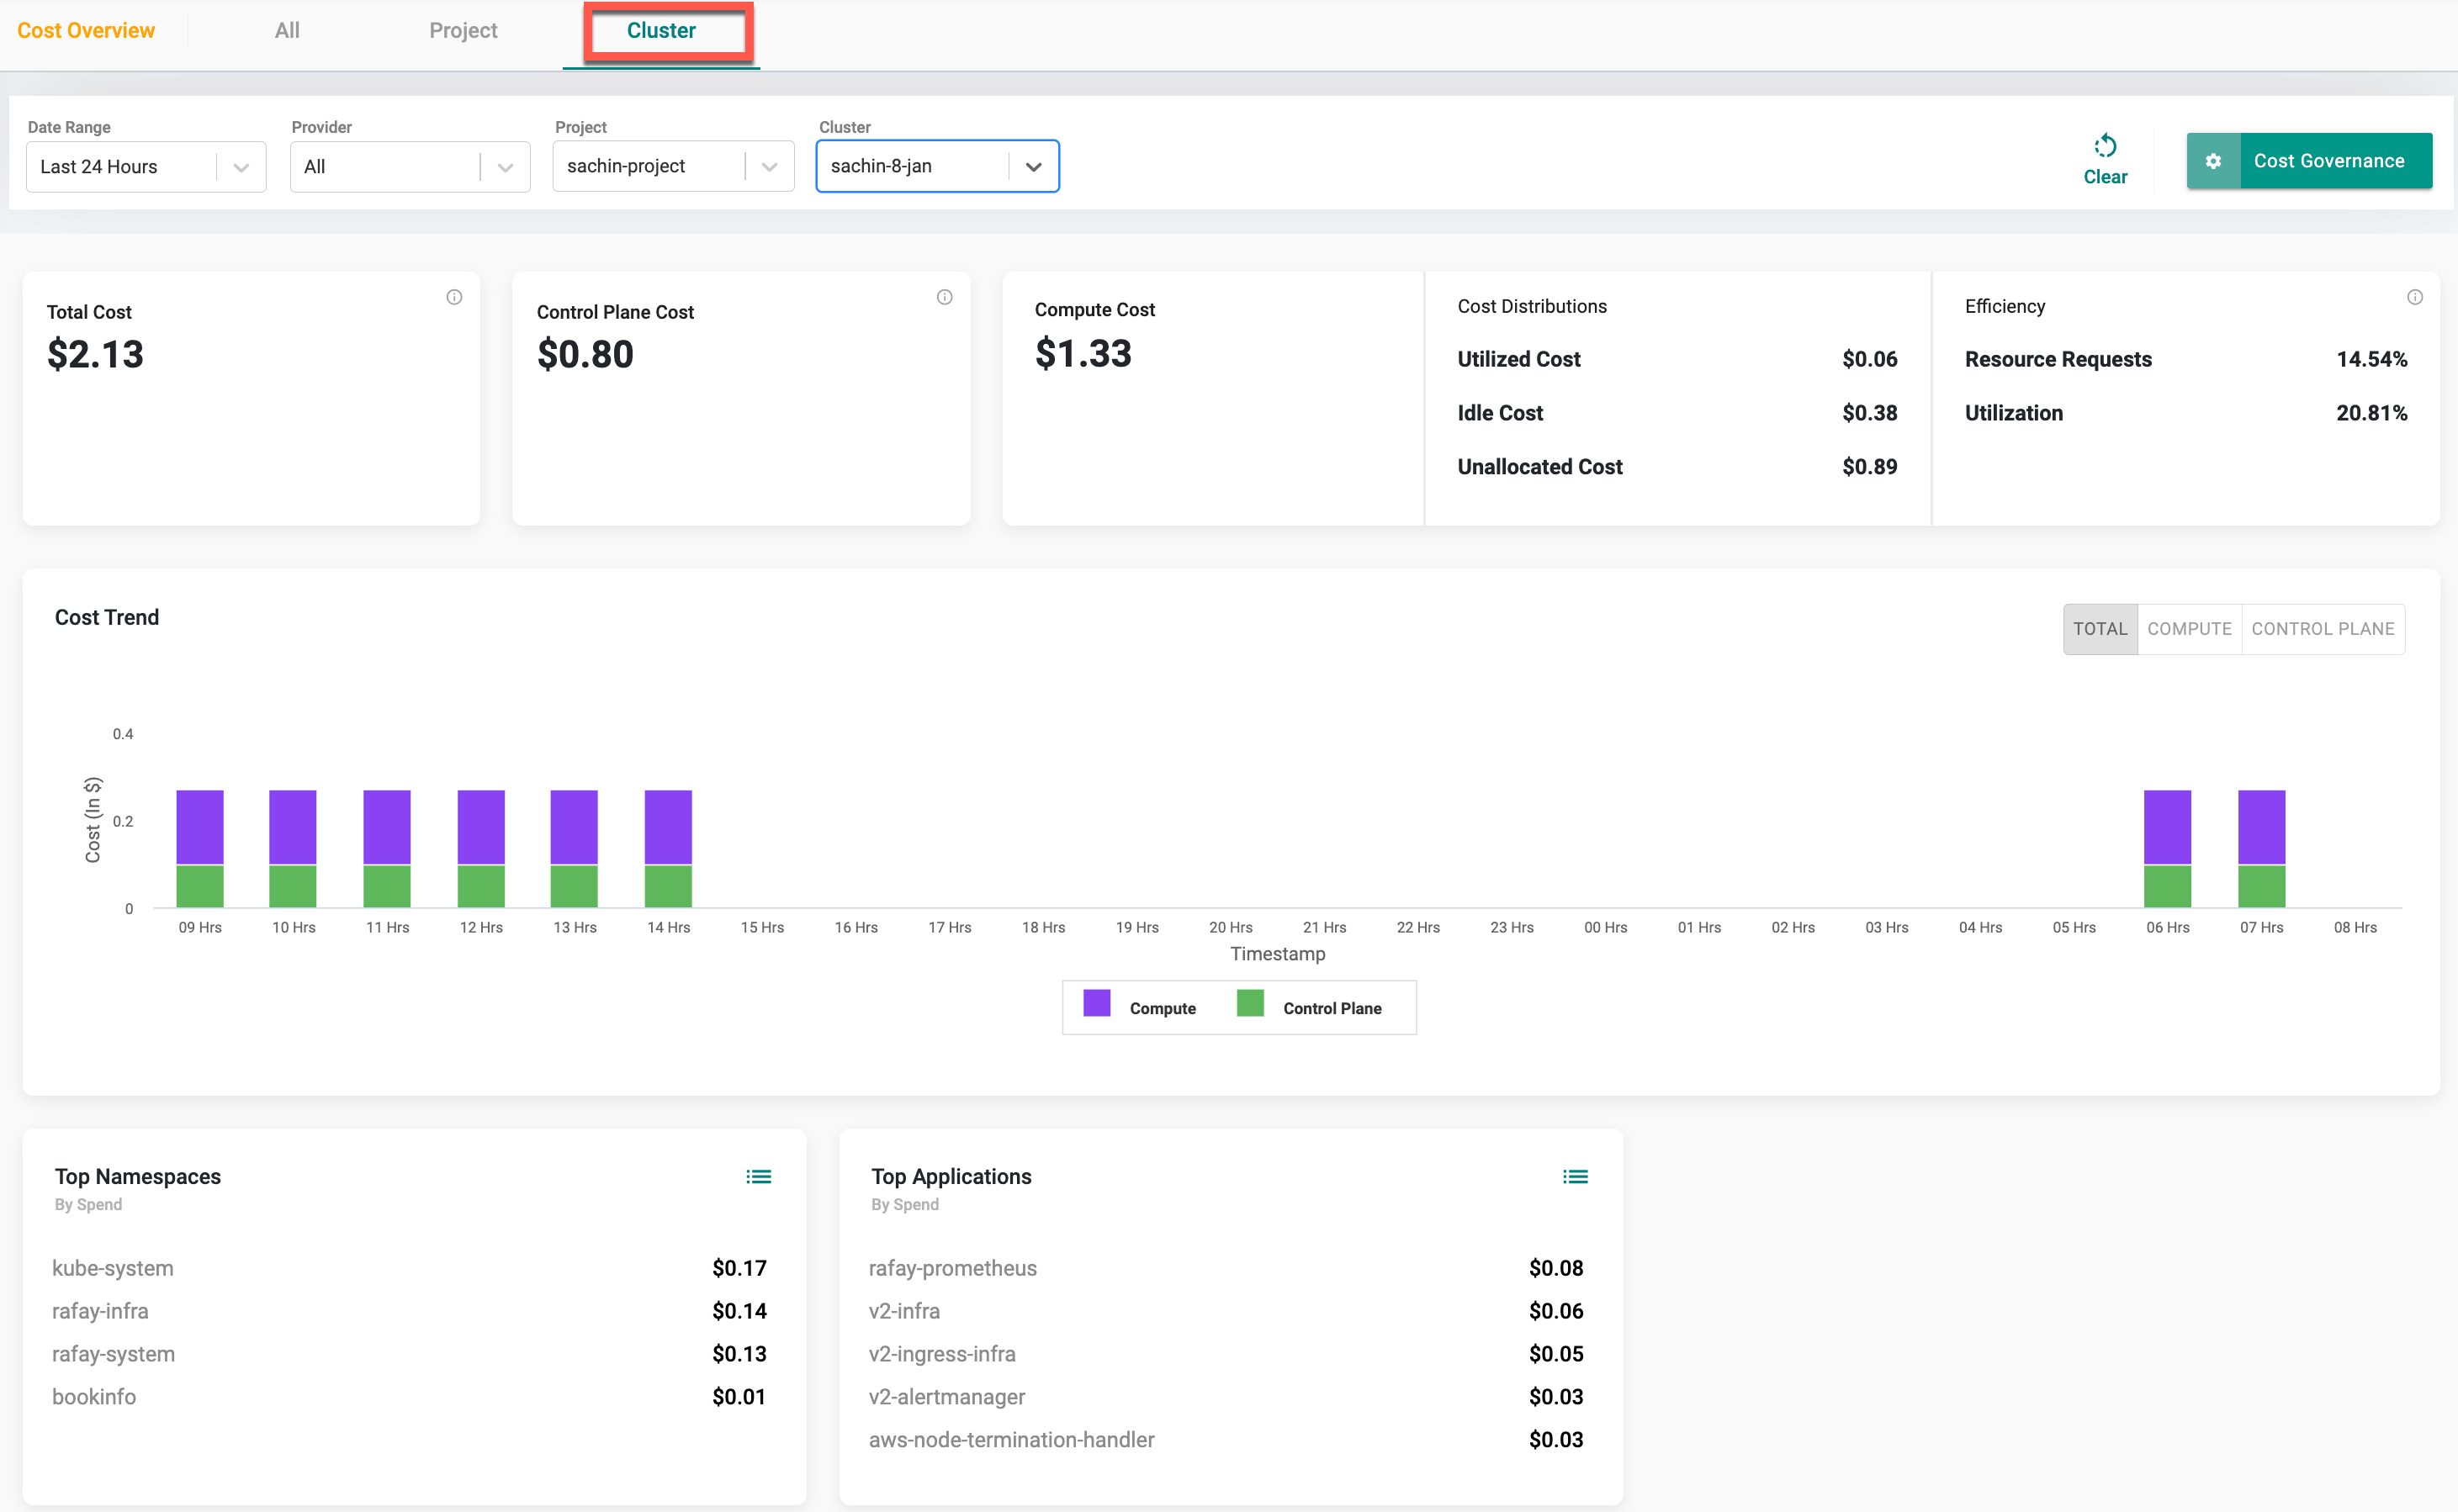
The Unallocated Cost will be empty when you select a project and a shared cluster.