Sumologic
- Sumo Logic
- SumoLogic
- Kubernetes
- Logging
Although the Kubernetes Management Operator on managed clusters provides integrated monitoring and visibility capabilities, organizations may have standardized on Sumo logic for their logging infrastructure.
Sumo logic provides a way to forward, store, and search your Kubernetes cluster and application logs. This recipe describes how customers can standardize the the collection of Managed Kubernetes Clusters' logs into their Sumo logic system.
What Will You Do
In this exercise,
- You will create a customized "sumologic" addon using Sumo logic's "official Helm chart"
- You will use the addon in a custom cluster blueprint
- You will then apply this cluster blueprint to a managed cluster
Important
This recipe describes the steps to create and use a custom cluster blueprint using the Web Console. The entire workflow can also be fully automated and embedded into an automation pipeline.
Assumptions
- You have already provisioned or imported one or more Kubernetes clusters using the controller
- You have access to a Sumo logic instance (Enterprise or Cloud)
- The sumo logic controller will be installed in addition to the Managed Kubernetes Cluster's logging agent
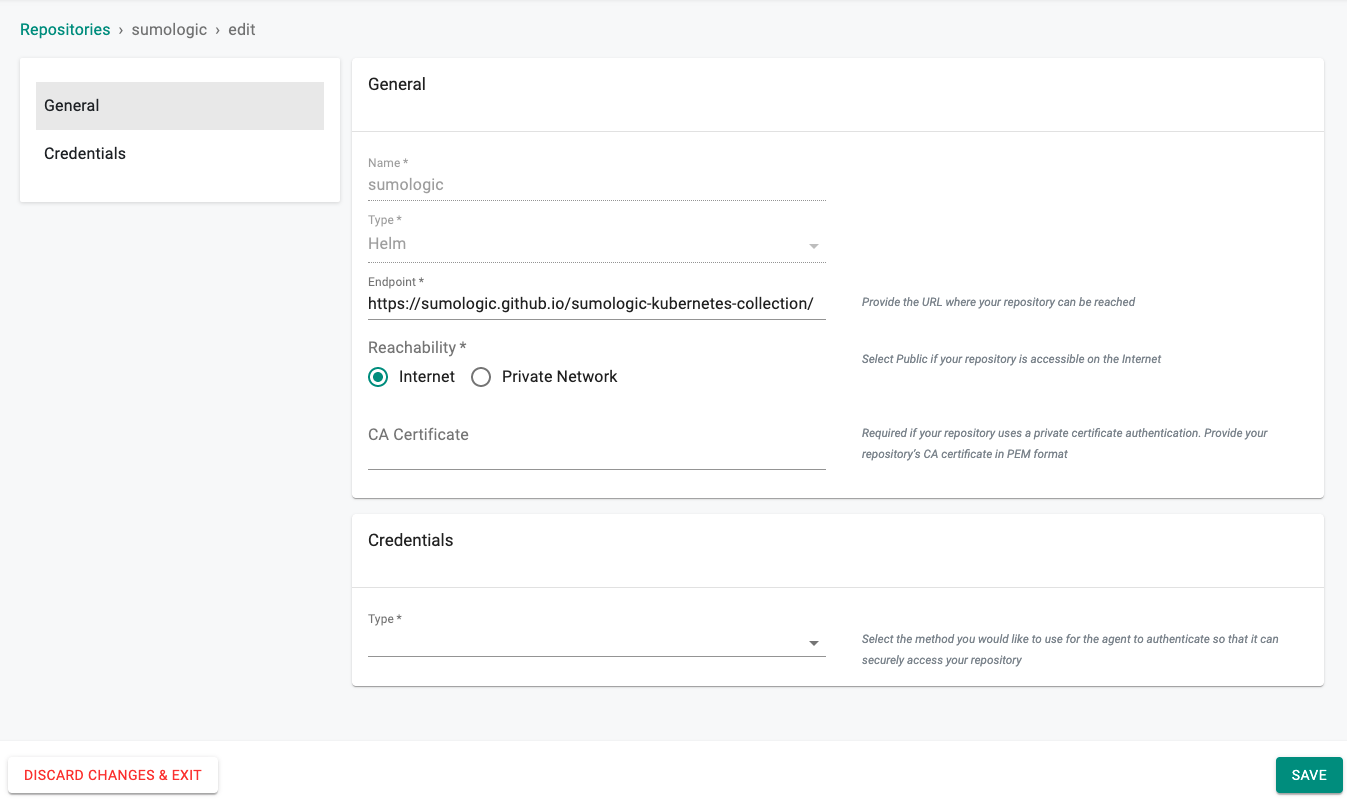
Step 1: Create the Sumologic Helm Repository
Additional information on downloading, packaging, and installing the the latest helm chart can be found here https://sumologic.github.io/sumologic-kubernetes-collection.
- Login into the Web Console and navigate to your Project as an Org Admin or Infrastructure Admin
- Under Integrations select "Repositories" and create a new Helm Repository called "sumologic" with the following Endpoint "https://sumologic.github.io/sumologic-kubernetes-collection/"
Step 2: Customize Values
The Sumo logic Helm chart comes with a very complex sumologic-custom-values.yaml file with support for a large number of scenarios. We will be customizing the default with our own override "sumologic-custom-values.yaml".
- Create a file named "sumologic-custom-values.yaml" using the following spec and update the highlighted lines with values that match your deployment
sumologic:
  ## Sumo access ID
  accessId: "suP08QRAygX4kw"
  ## Sumo access key
  accessKey: "QjRfTNRq9Enw6UZ2u775EsHvJl8q66gN5ystgiNjQk9qWOTQ2NuTv4KFSzMdjg5Z"

  clusterName: "my-cluster-name"

  metrics:
    enabled: false

kube-prometheus-stack:
  enabled: false
  prometheus-node-exporter:
    service:
      port: 9200
      targetPort: 9200
Step 3: Create Addon
- Login into the Web Console and navigate to your Project as an Org Admin or Infrastructure Admin
- Under Infrastructure, select "Namespaces" and create a new namespace called "sumologic"
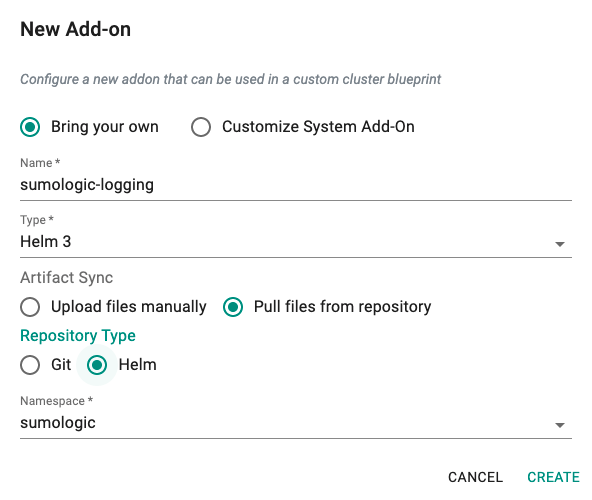
- Select "Addons" and "Create" a new Addon called "sumologic-logging"
- Ensure that you select "Helm" for type, "Pull files from repository" for the Artifact Sync, "Helm" for the Repository Type, and select the namespace as "sumologic"
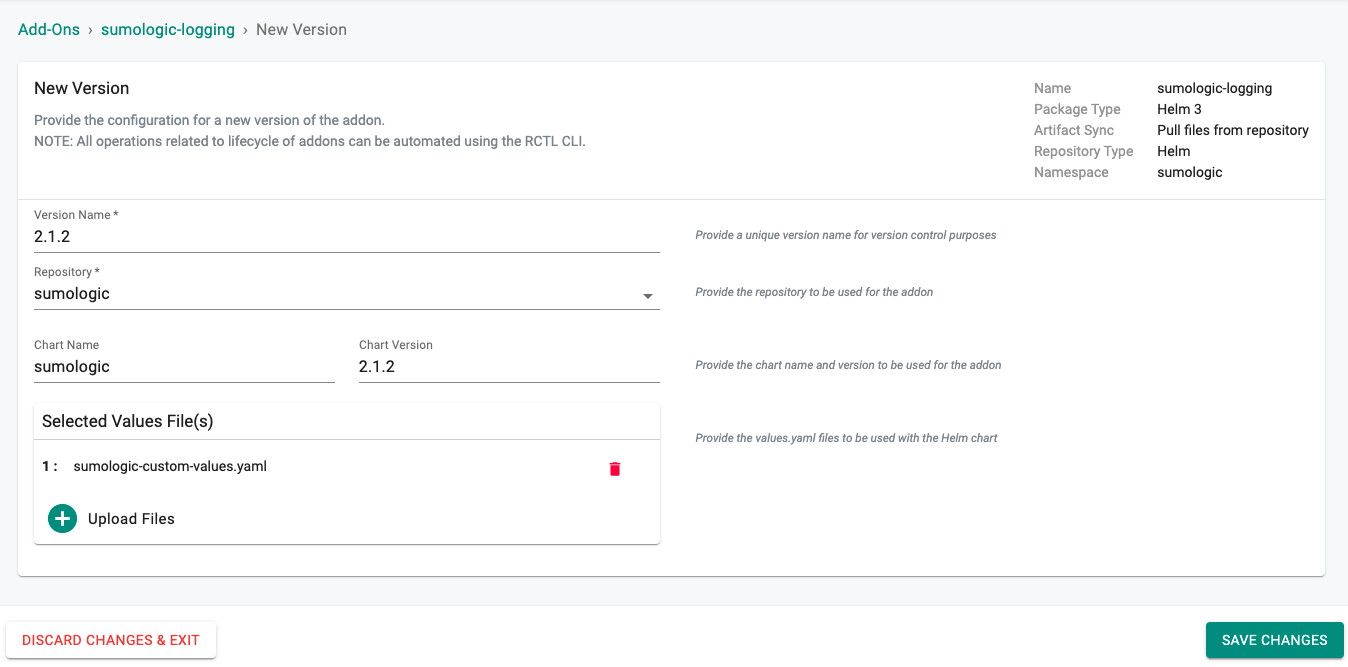
- Select "New Version" and set the Version Name to "2.1.2", The Repository to "sumologic", Chart Name to "sumologic", Chart Version to "2.1.2", upload the custom values file "sumologic-custom-values.yaml", and click on "SAVE CHANGES"
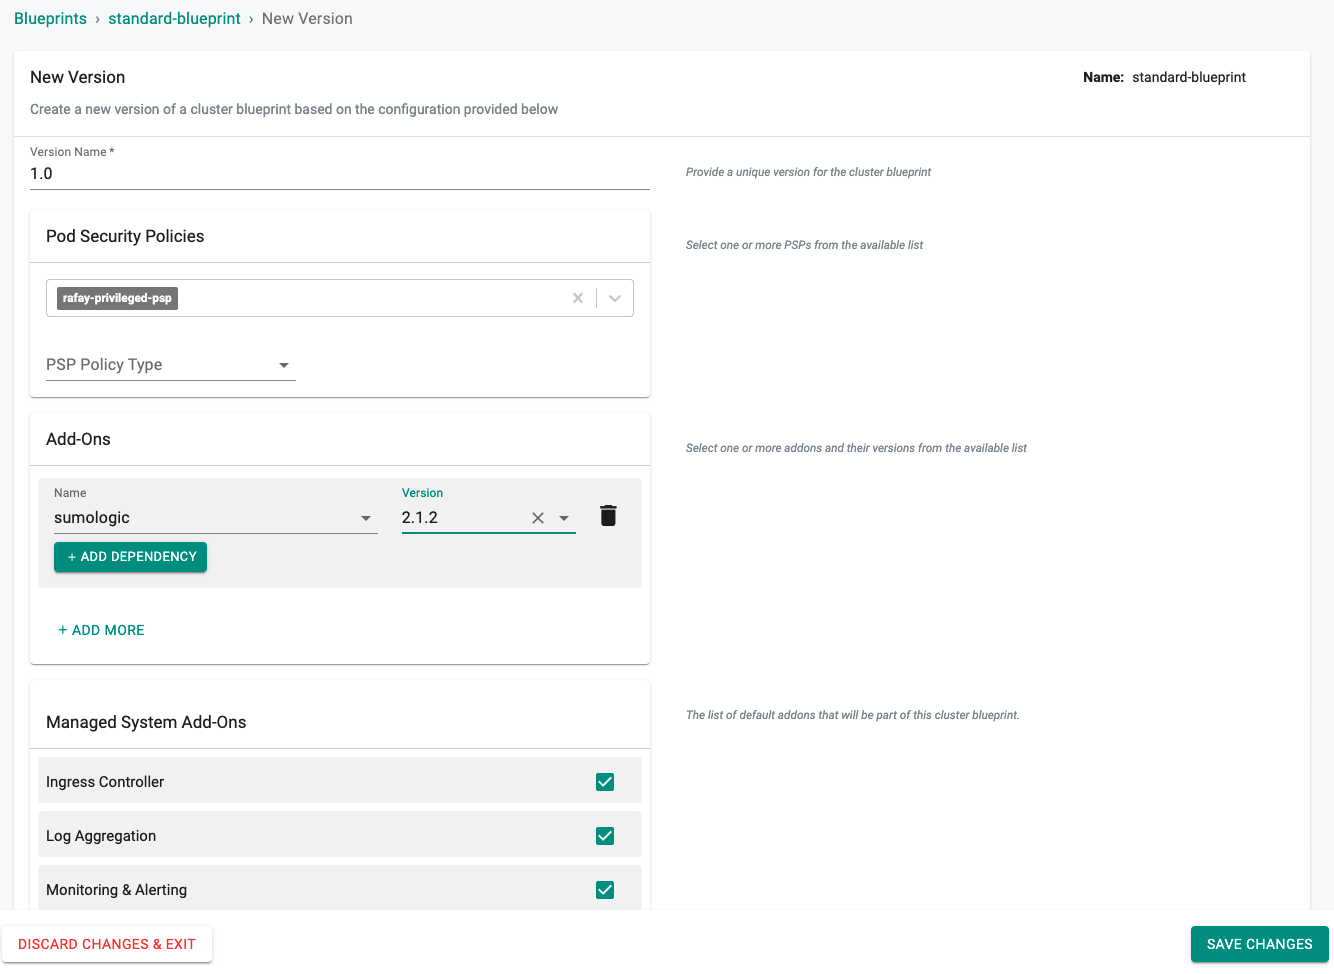
Step 4: Create Blueprint
Now, we are ready to assemble a custom cluster blueprint using the newly created Sumologic addon. We can add additional addons to the blueprint at the same time.
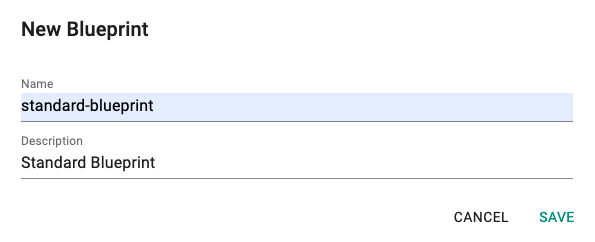
- Under Infrastructure, select "Blueprints"
- Create a new blueprint and give it a name such as "standard-blueprint"
- Select the sumologic addon and "SAVE CHANGES"
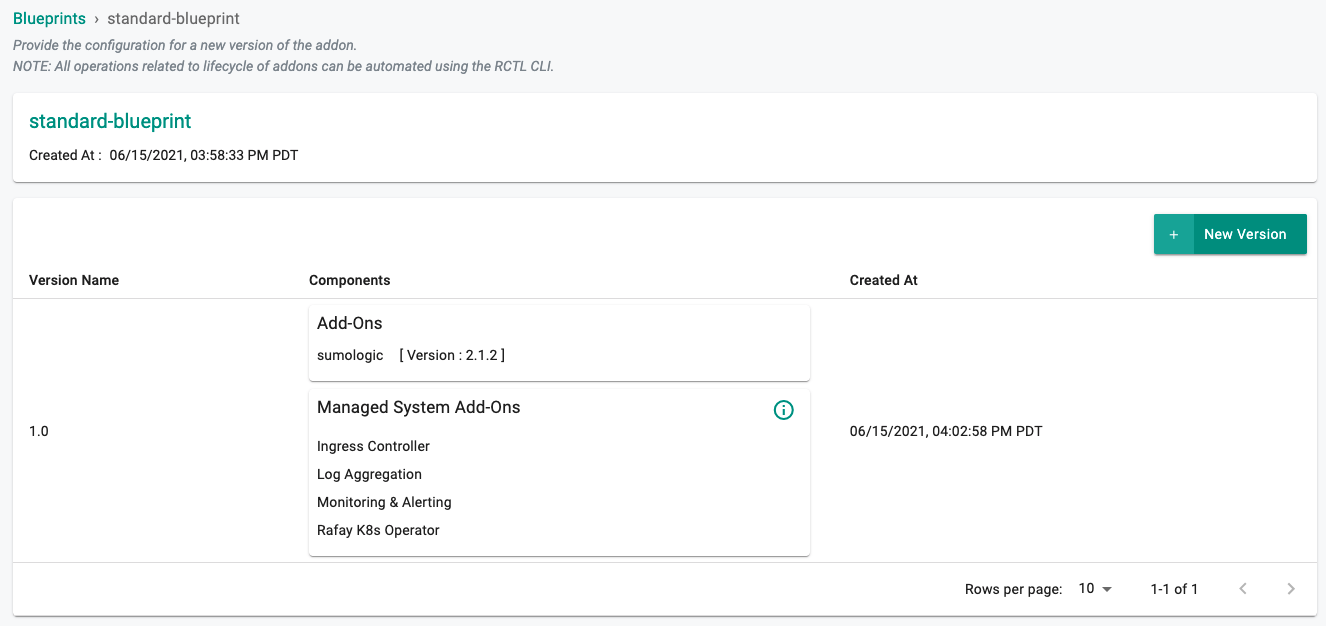
- Once the blueprint is created we can apply it to a cluster
Step 5: Apply Blueprint
Now, we are ready to apply this custom blueprint to a cluster.
- Click on Options for the target Cluster in the Web Console
- Select "Update Blueprint" and select the "standard-blueprint" blueprint we created from the list
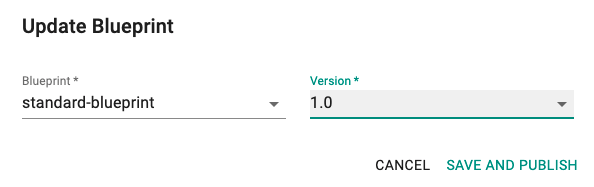
- Click on "SAVE AND PUBLISH".
This will start the deployment of the addons configured in the "standard-blueprint" blueprint to the targeted cluster. The blueprint sync process can take a few minutes. Once complete, the cluster will display the current cluster blueprint details and whether the sync was successful or not.
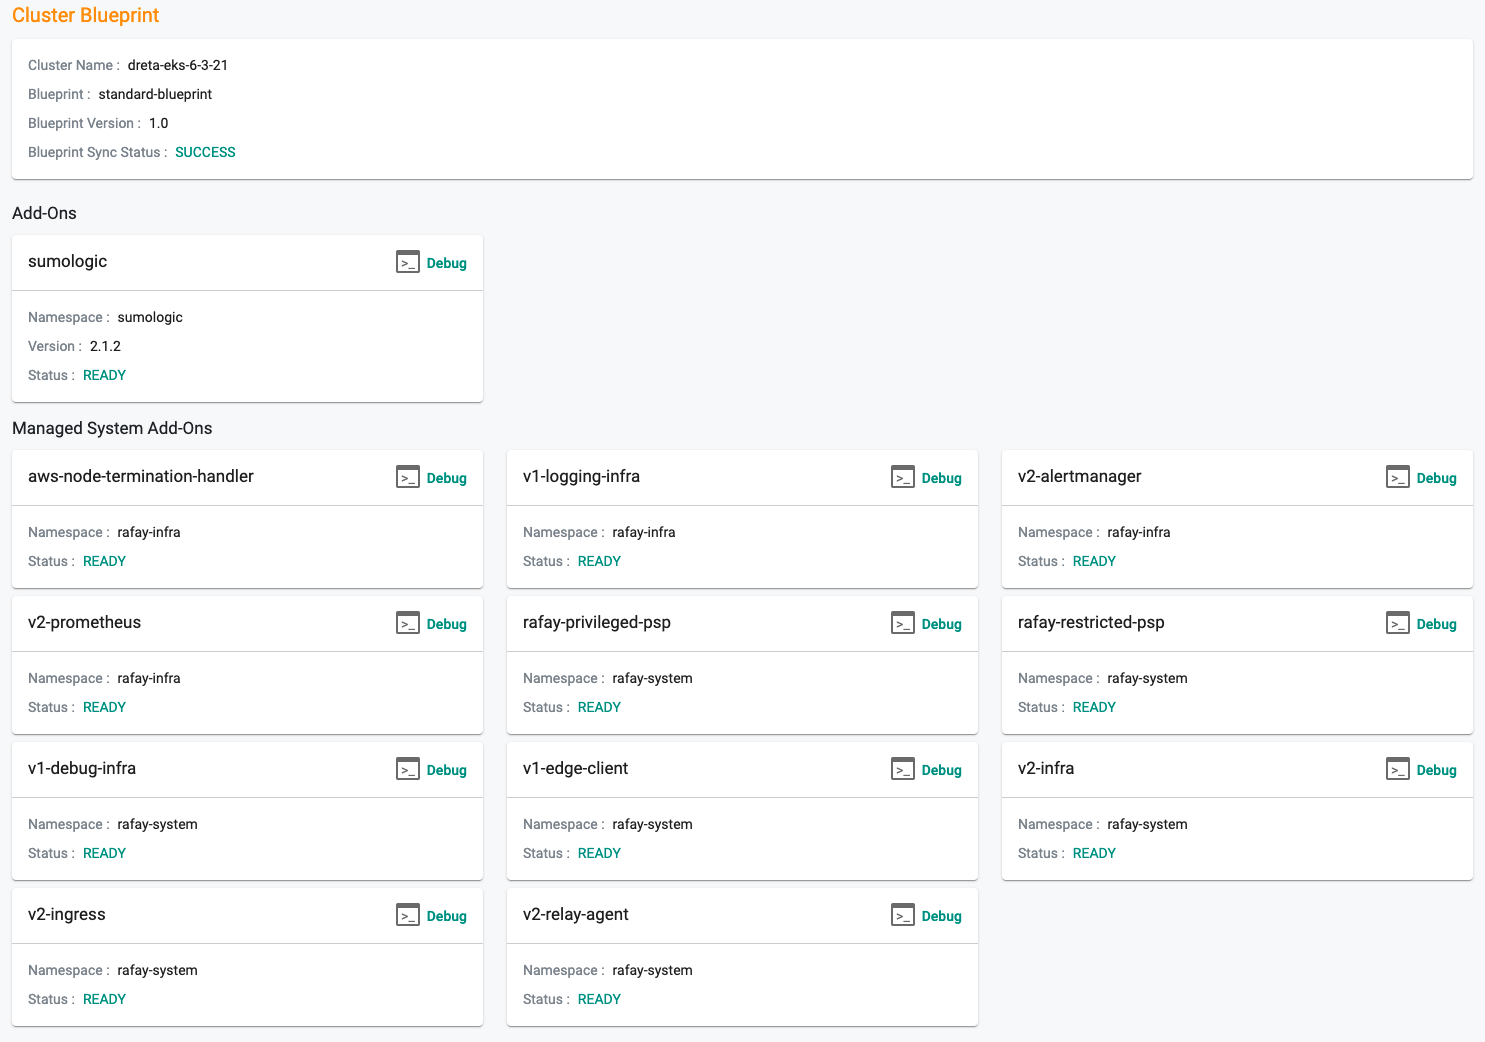
Step 6: Verify Blueprint
Users can optionally verify whether the required resources for the custom blueprint were created on the cluster. Click on the Kubectl button on the cluster to open a virtual terminal
First, we will verify if the "sumologic" namespace has been created
kubectl get ns sumologic

NAME             STATUS   AGE
sumologic        Active   6m17s
Next, we will verify that the required pods were created in the "sumologic" namespace. You should see something like the example below.
kubectl get pod -n sumologic

NAME                                   READY   STATUS    RESTARTS   AGE
sumologic-fluent-bit-4q5mw             1/1     Running   0          88s
sumologic-fluent-bit-rpb4x             1/1     Running   0          88s
sumologic-sumologic-fluentd-events-0   1/1     Running   0          88s
sumologic-sumologic-fluentd-logs-0     1/1     Running   0          88s
sumologic-sumologic-fluentd-logs-1     1/1     Running   0          88s
sumologic-sumologic-fluentd-logs-2     1/1     Running   0          88s
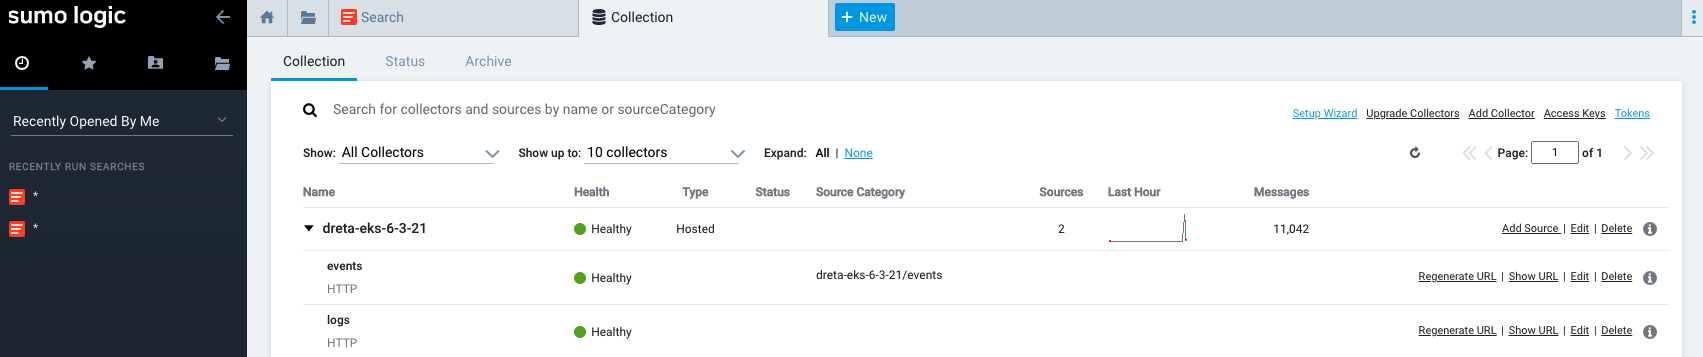
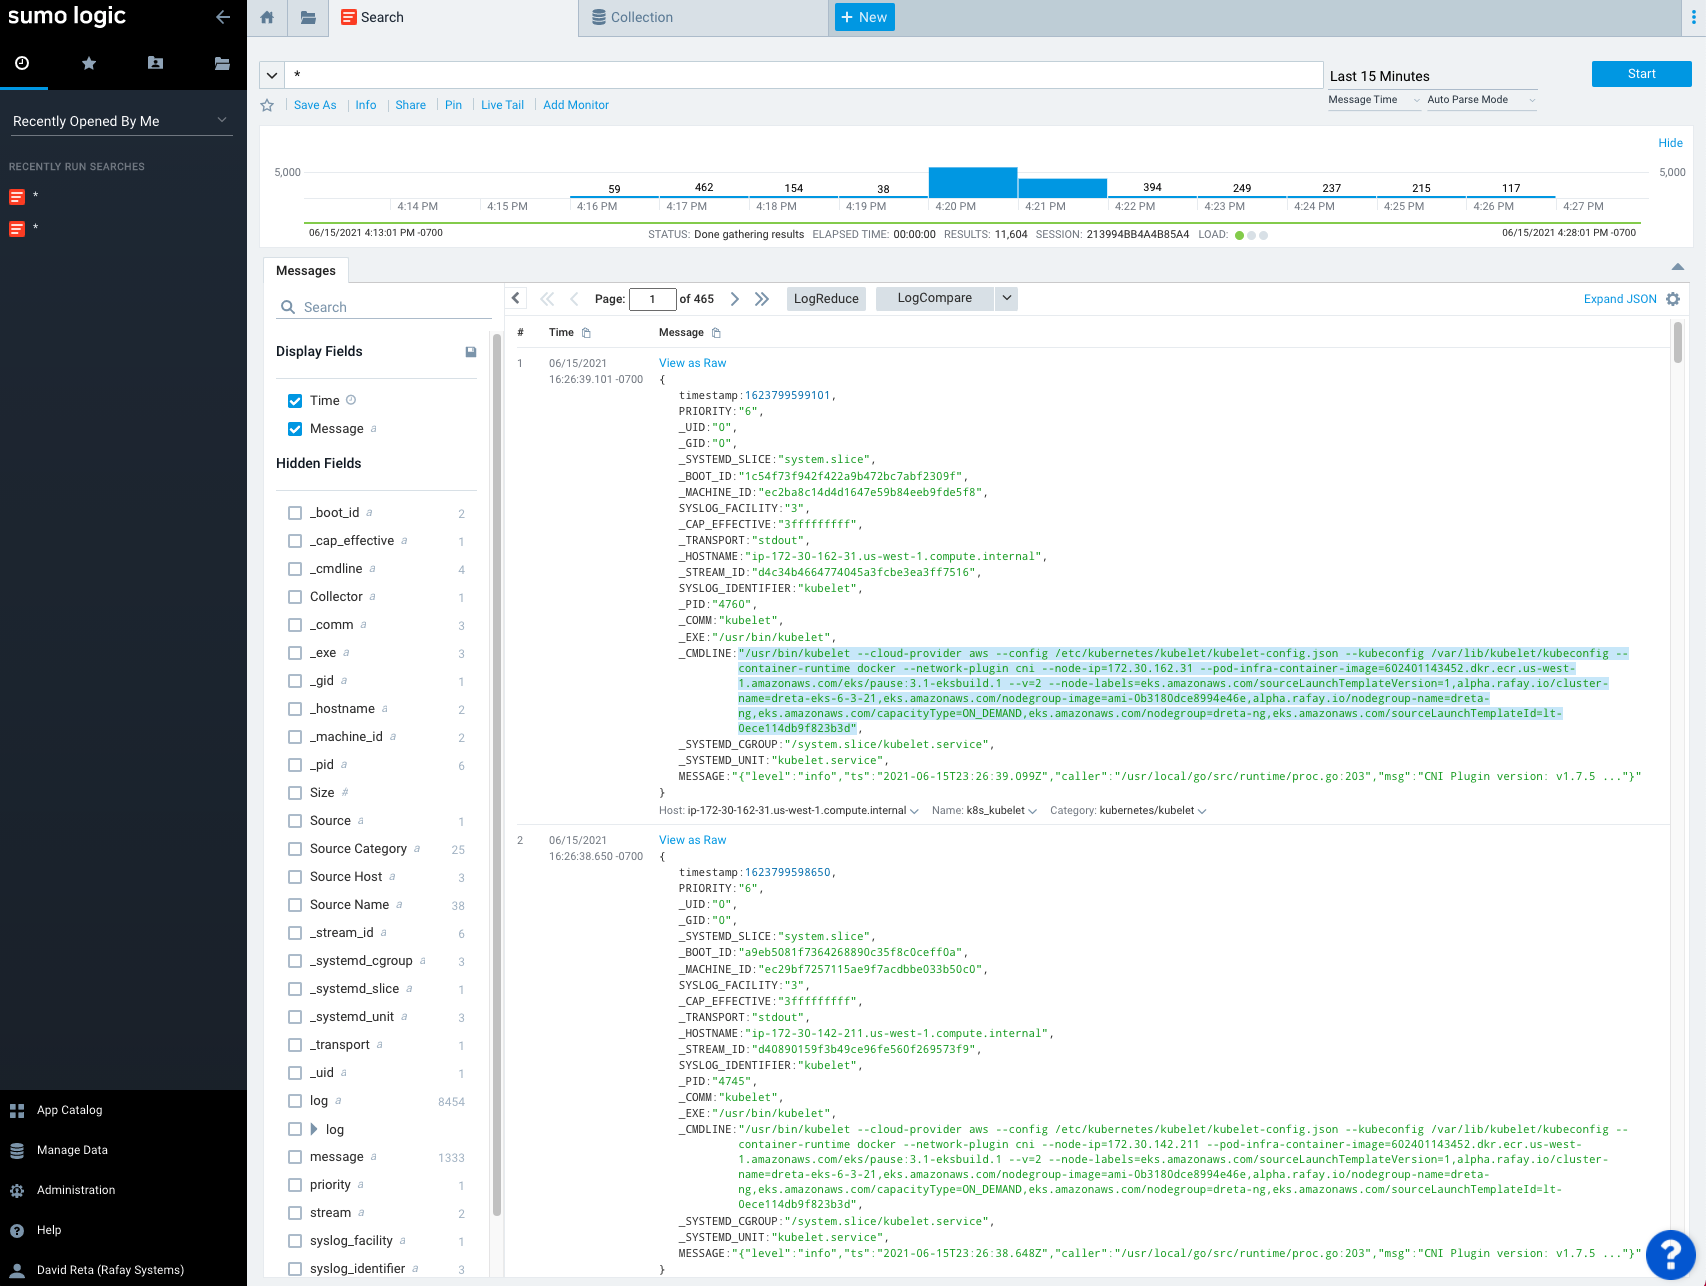
Step 7: View Data in Sumologic
Now, we will access our Sumologic instance to view the logs and metrics data collected from the cluster. Shown below is an illustrative example of collections created and a sample of the cluster and application logs collected by Sumologic.
- Collections
- Dashboard
Recap
Congratulations! You have successfully created a cluster blueprint with the sumologic addon and applied it to a cluster. You can now use this blueprint on as many clusters as you require.