Developer Tools
Unlike cluster administrators, developers and application owners typically do not have low level access to cluster wide resources. They are typically only provided with project or namespace roles. However, they need the ability to quickly debug and diagnose issues when they occur. To assist with this, the controller provides this persona with a number of turnkey facilities that
- Provide deep visibility/insight into the state of their workloads and
- Provide the means to quickly debug and diagnose issues with k8s resources associated with their workloads
- Provide both current status and trends of health.
Project Dashboard
All authorized users in a Project have access to the Project Dashboard that will give them a unified, at-a-glance view into the state of their clusters, workloads and activity.
Deployment Status
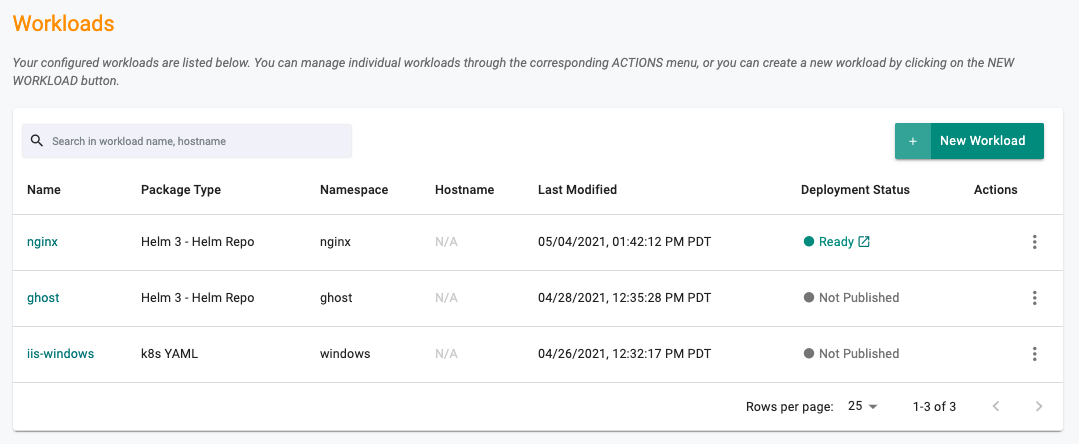
A workload can comprise 100s or 1000s of distinct Kubernetes resources. The controller actively monitors the deployment status of all the k8s resources for a workload on remote clusters. To view the deployment status of a workload,
- Navigate to your Project and Select Workloads
Note
A READY state for for deployment status means that all k8s resources associated with the workload were successfully deployed.
Developer Tools
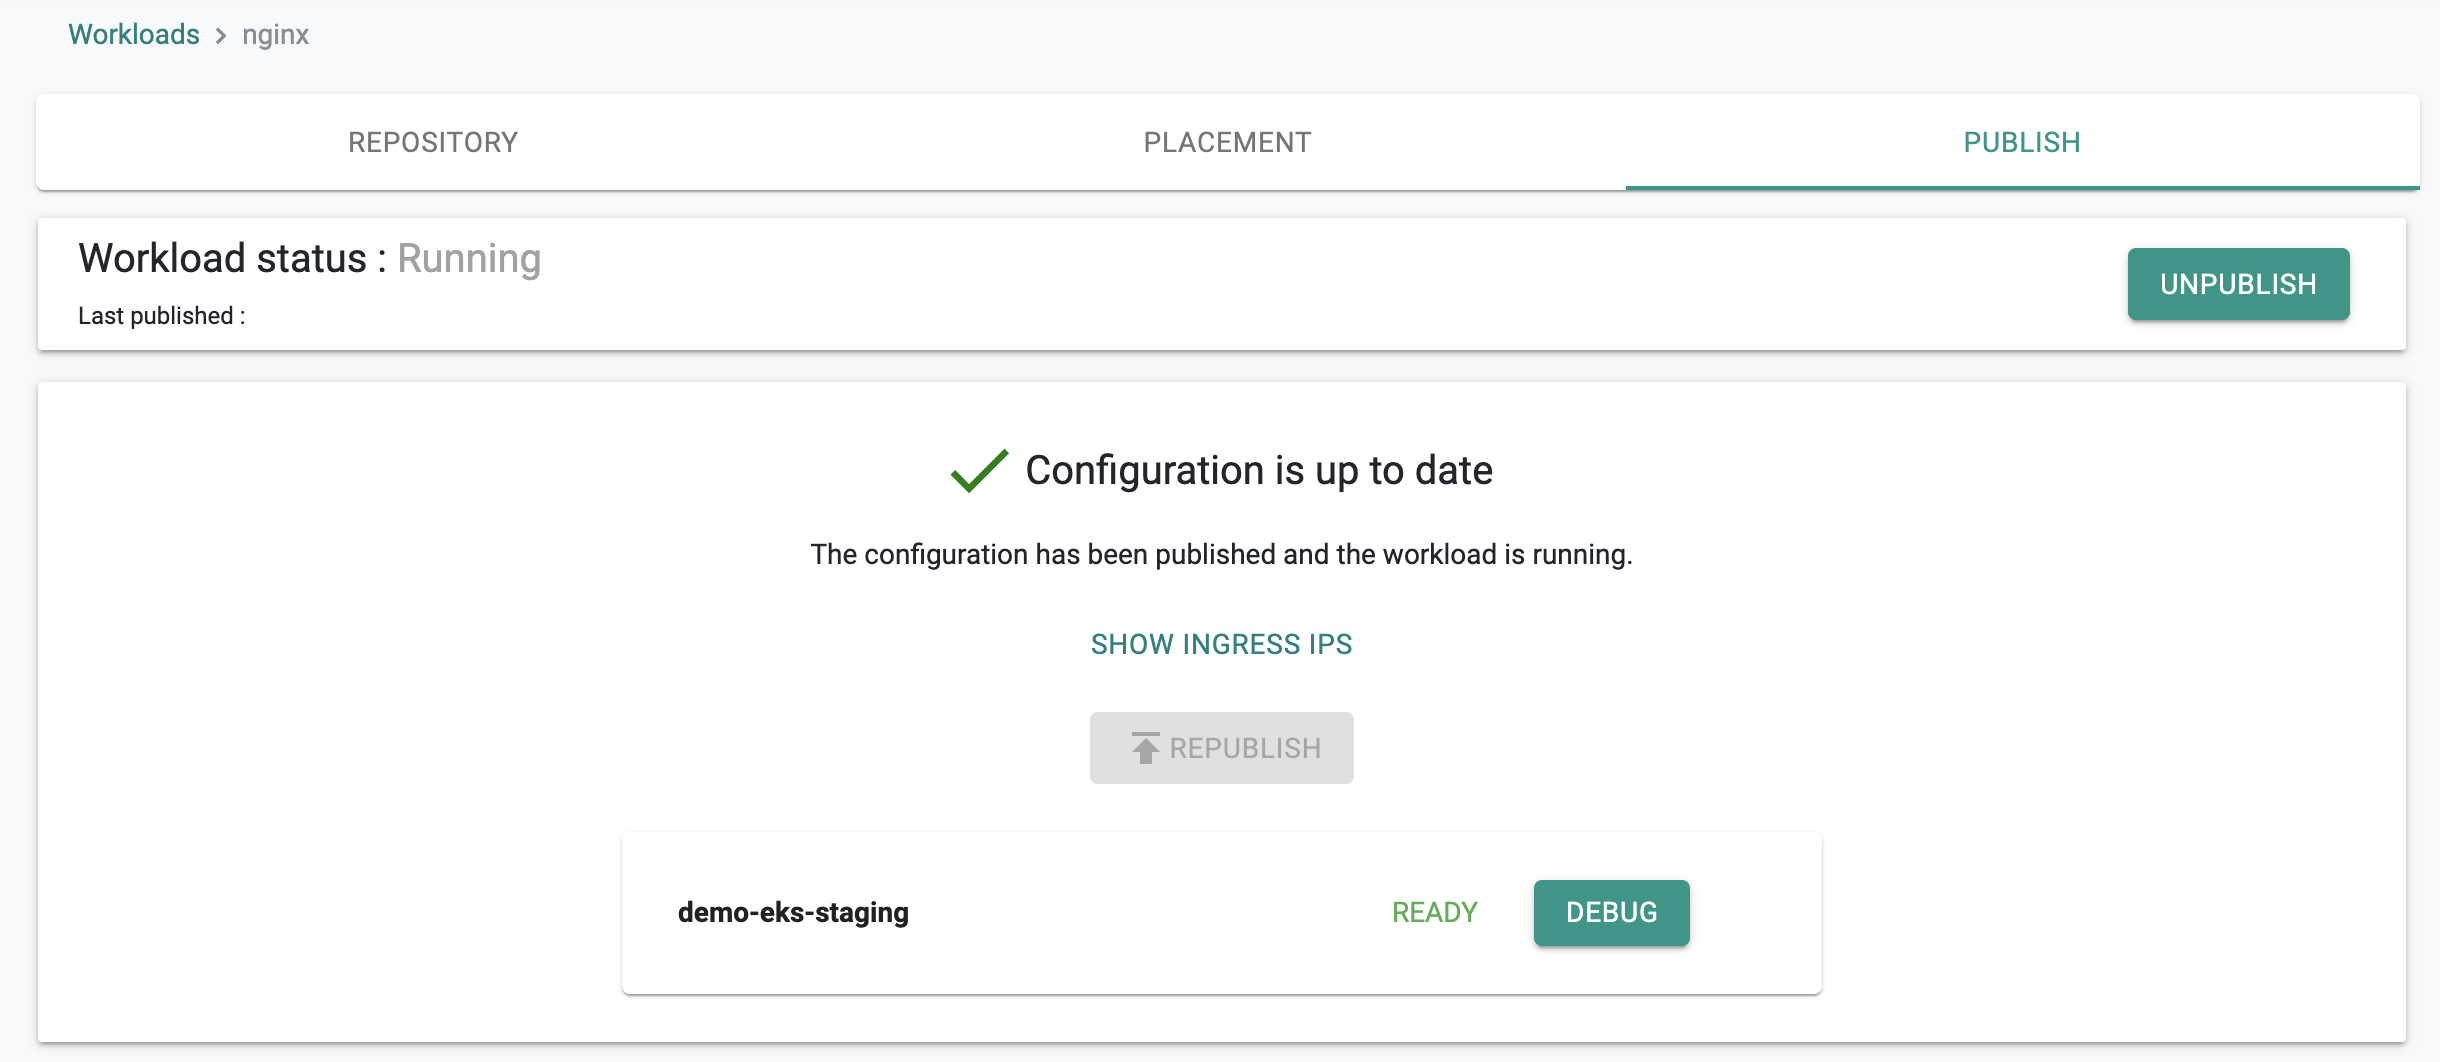
This section describes the various facilities available to developers to help them troubleshoot and debug issues with their workloads quickly and efficiently. Once the developer logs into their Project and navigate to their workload, they literally just have to click on the Debug button to get access to the developer tools.
Zero Trust Channel
The developer does not require inbound or privileged access to remote Kubernetes clusters to perform diagnostics.
- Everything is performed over the zero trust control channel between the managed cluster and the controller.
- The developer has to be strongly authenticated and authorized by the controller before they are able to access the built in developer tools.
- An audit log of all activity is maintained for compliance and governance.
Zero Trust Kubectl
The developer is provided a facility to launch a secure, web based kubectl shell to the remote cluster. The developer is taken right to the namespace where the workload is deployed to.
Multi Cluster Views
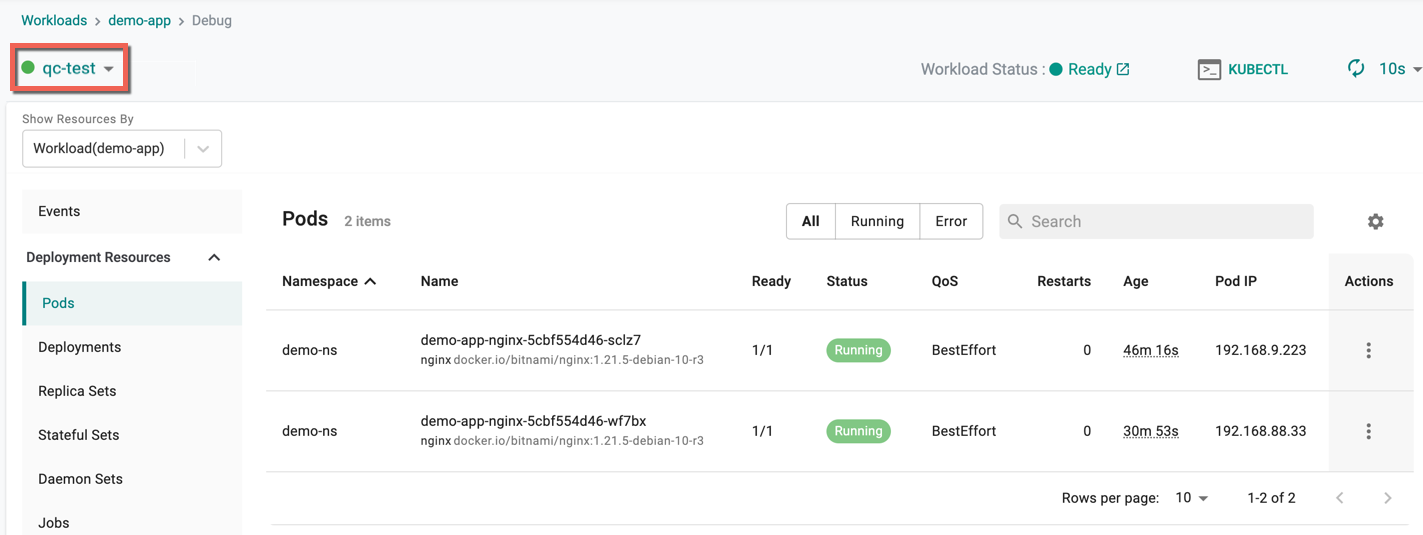
If workloads that are deployed on multiple clusters, the developer can seamlessly switch the developer tools view from cluster to cluster by selecting the "name of the cluster" on the top left.
Kubernetes Events
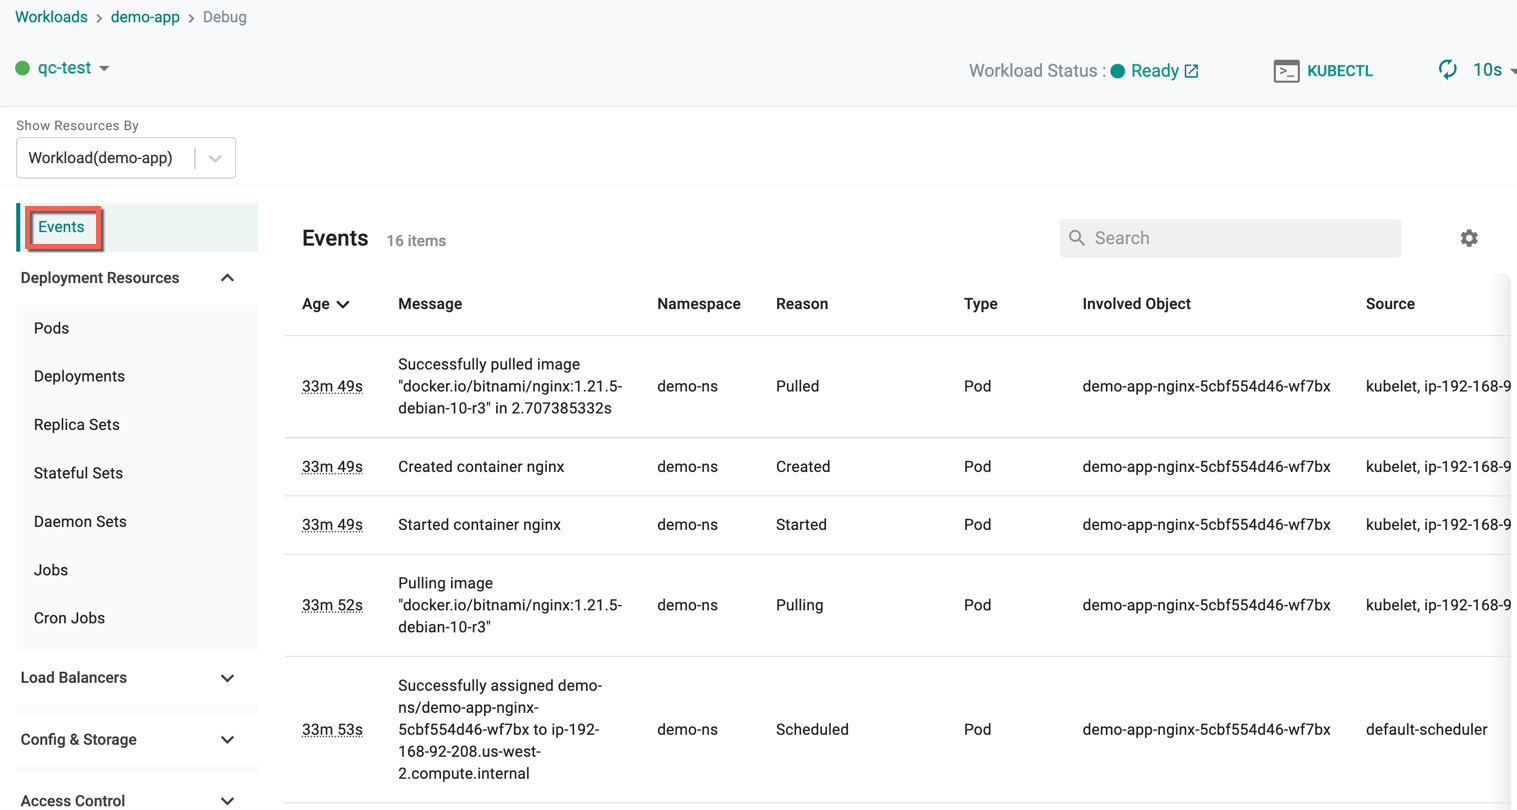
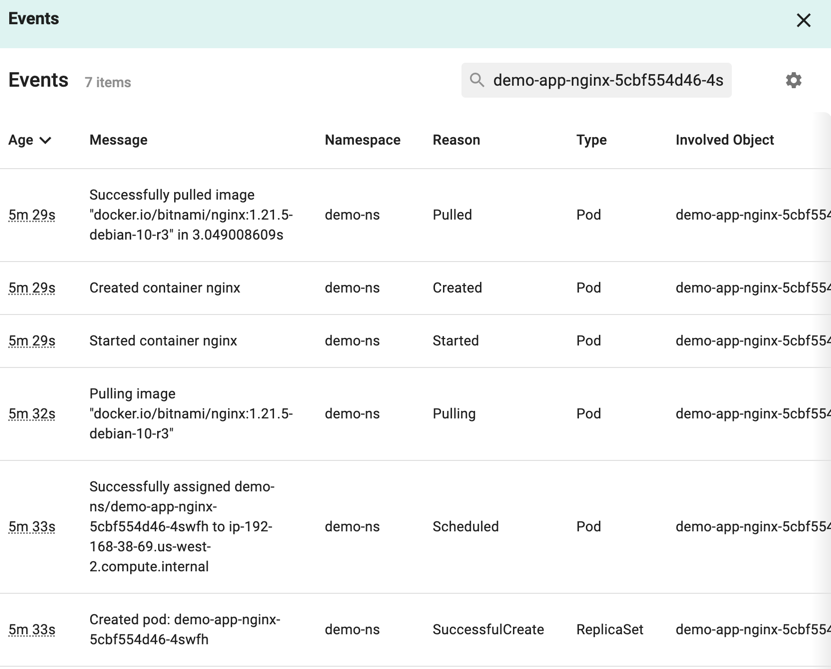
Kubernetes events are a resource type in Kubernetes that are automatically created when resources have state changes, errors, or other messages that should be broadcast to the system. Events are an invaluable resource when debugging issues in your Kubernetes cluster. Developers are provided with a "pre-filtered" list of events for all resources associated with their workload.
Kubernetes Resources
Developers also have access to a pre-filtered list of all Kubernetes resources associated with their workload. All the resources are organized and presented in a manner that is intuitive and easy for the developer to process.
- Events
- Deployment Resources (Pods, Deployments, ReplicaSets, StatefulSet, DaemonSets, Jobs, & Cron Jobs)
- Load Balancers (Ingress & Services)
- Config and Storage (Secrets, PVCs, & ConfigMaps)
- Access Control (Roles, Role Bindings & Service Accounts)
Pod and Container Trends
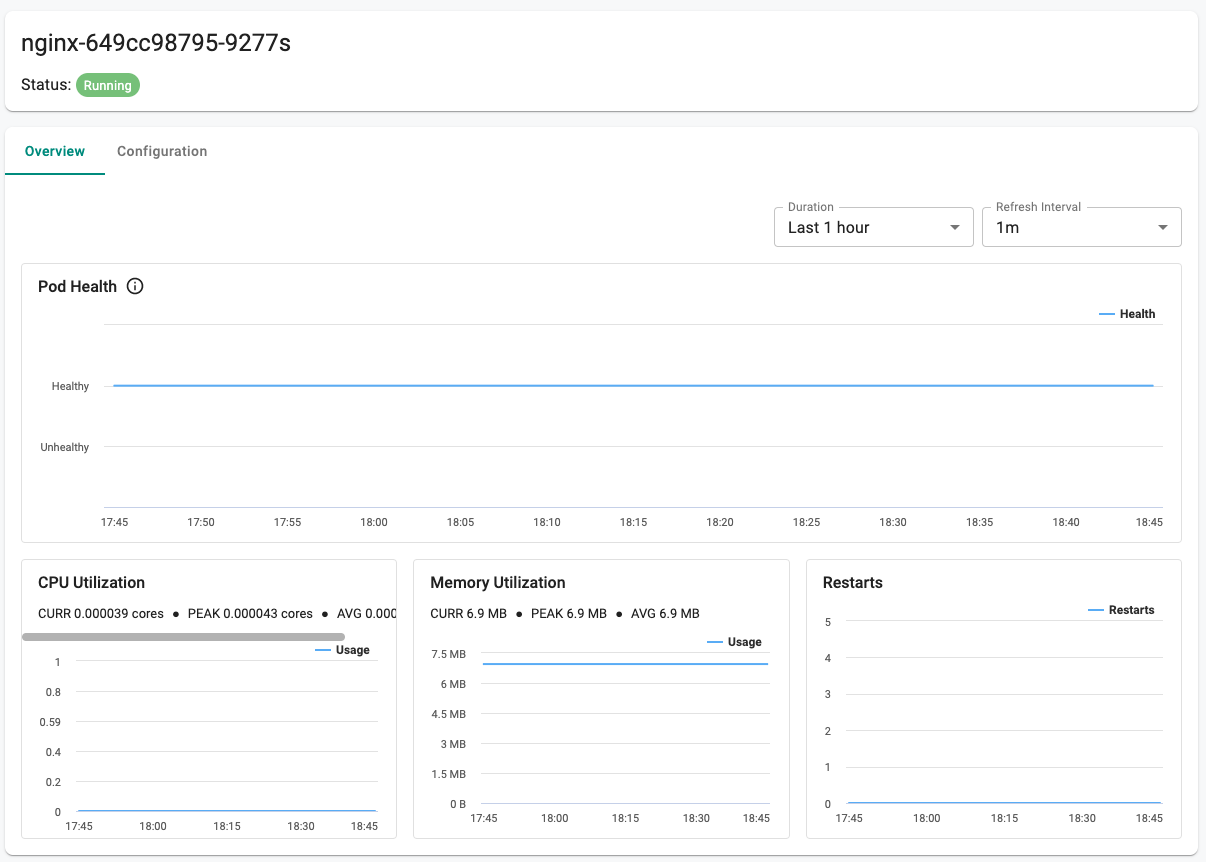
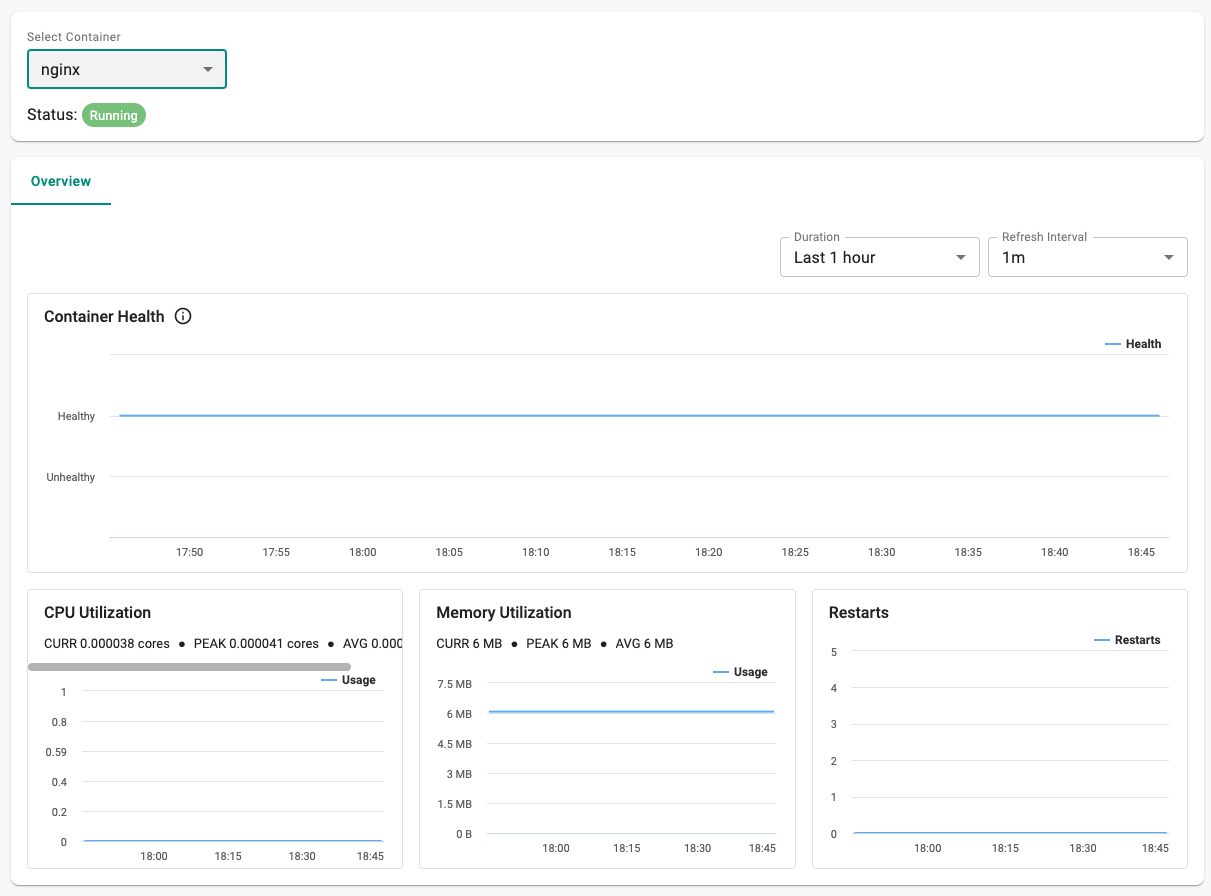
For all deployed pods and containers associated with the workload, the developer is provided visibility into time series data for the health and resource utilization trends.
For pods
For Containers in Pods
Pod/Container Diagnostics
Developers are provided with the facility to quickly investigate and debug issues associated with their running Pods and Containers.
Actions
Developers are provided with a number of contextual actions to perform on workload resources.
Refer Actions section in K8s Resources to know the actions availability for each resource.
Edit Yaml
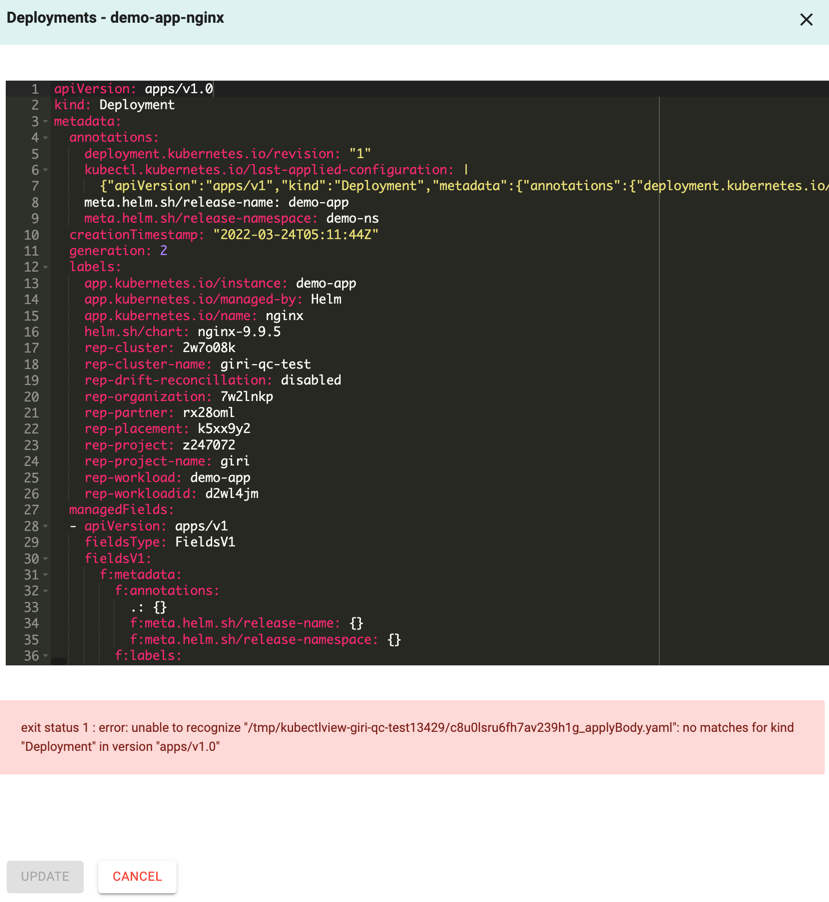
Administrators can edit the running workload resource(s) yaml file using the Edit Yaml option
A yaml config file appears on the right pane. You can update a few parameters that are allowed and click Update. For scenarios where a parameter is not allowed to update, an error message appears as shown in the below example
Describe
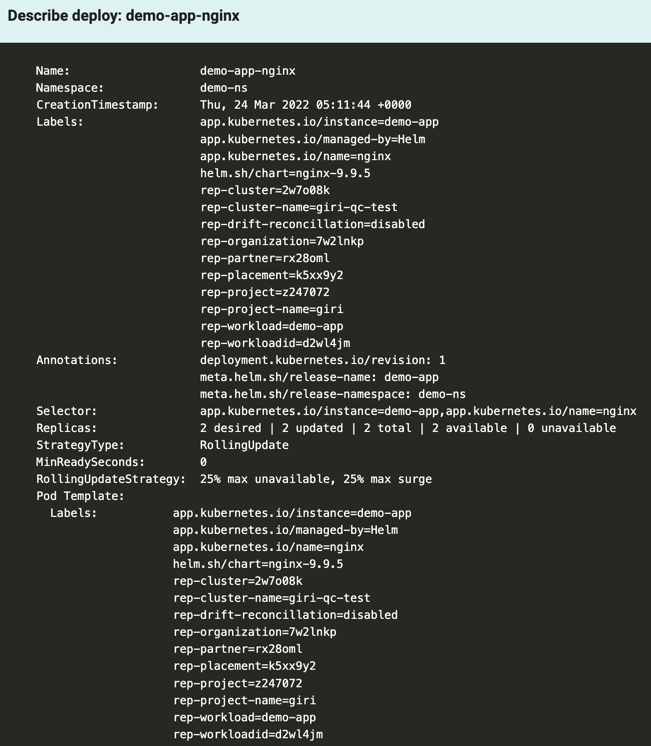
For scenarios where the developer may need to view the k8s yaml for a workload resource to investigate issues. For a workload resource, click Describe under Actions.
This will show the k8s yaml describing the resource operational on the remote cluster.
Downloads
To download the workload resource yaml file to your system, click Download.
On successful download, a success message appears as shown in the below example.
Events
Developers are provided the facility to quickly view the events associated with their Pod. For a workload pod, click on Events under actions.
This action performs a live retrieval of pre-filtered list of events associated with this pod.
Container Logs
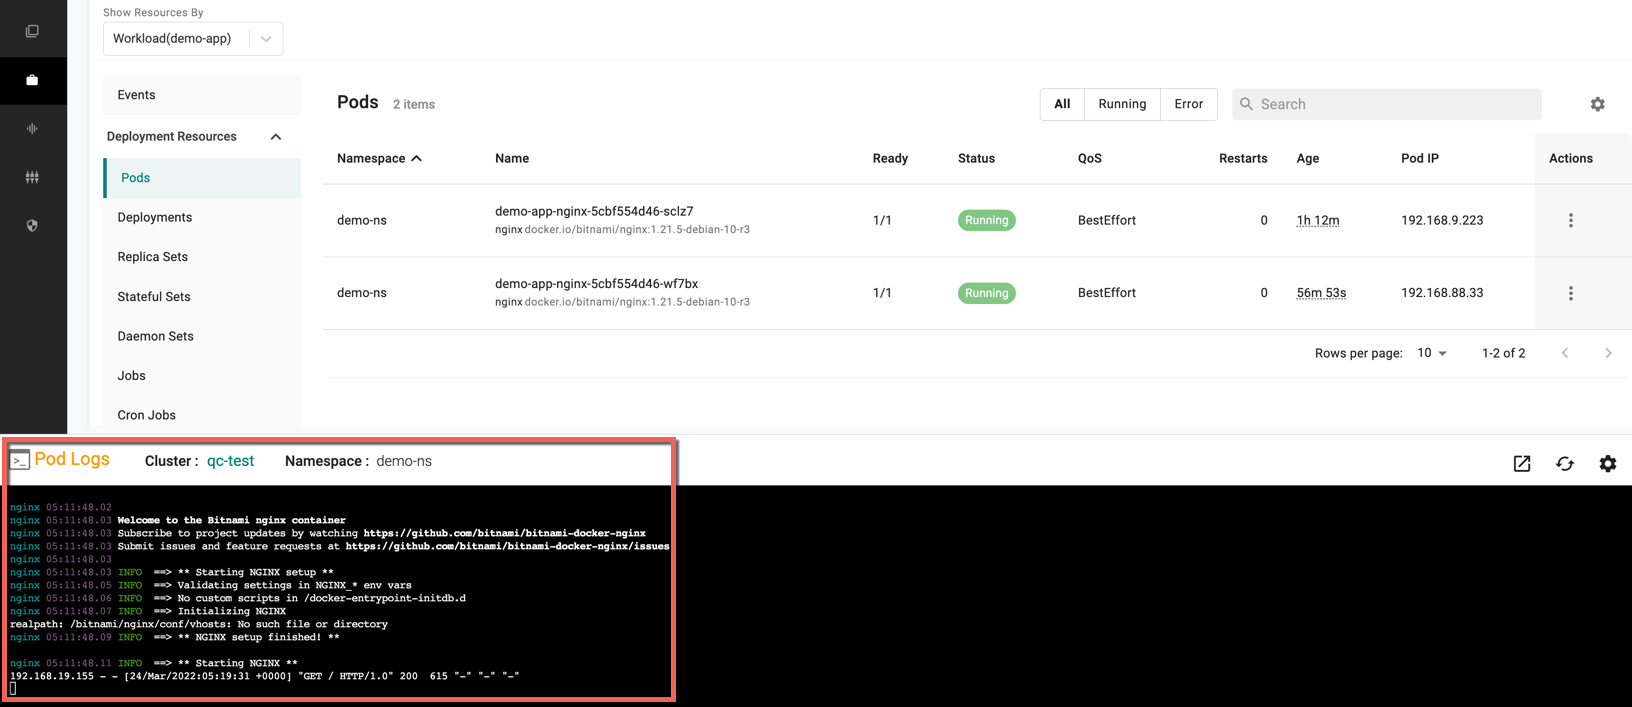
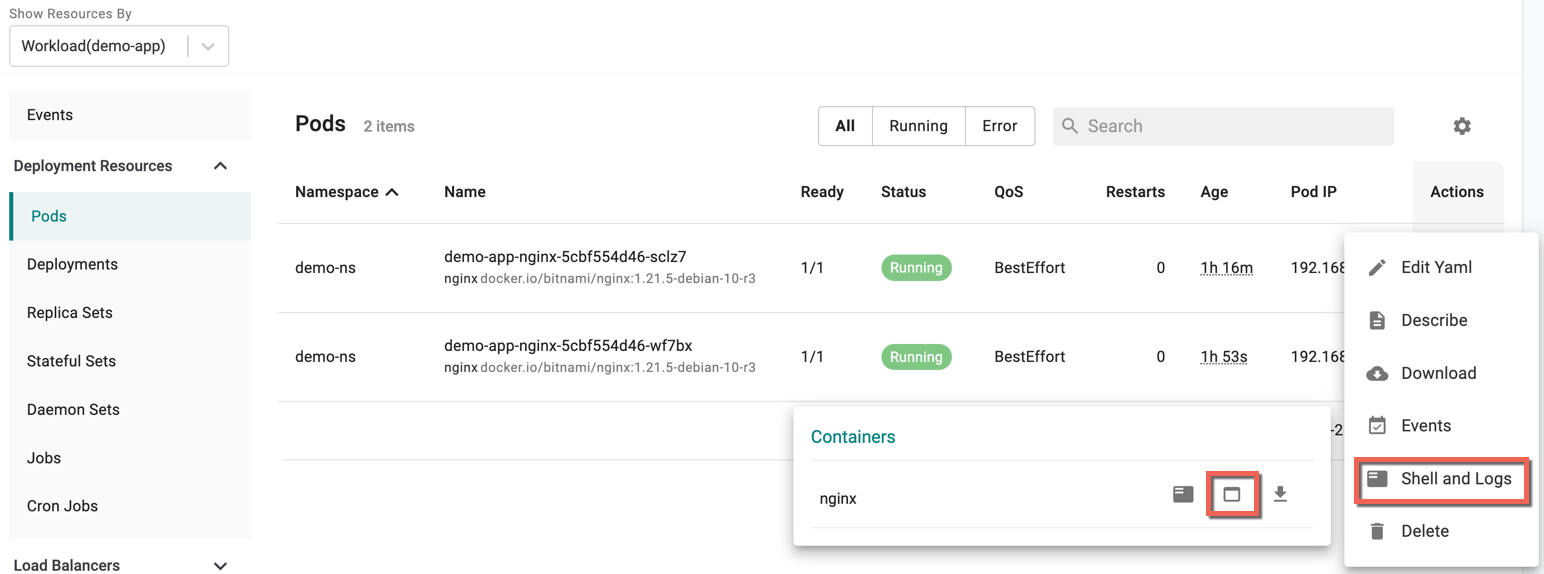
Developers are provided the facility to retrieve and view the logs associated with a specific container in a single click. This enables them to investigate issues quickly and efficiently. For a workload pod, select Shell and Logs under Actions and click Logs icon.
This will open a real time, Zero Trust Kubernetes Access (ztka) shell to the running container and present the developer with the Logs.
Exec to Container
There are scenarios where the developer may need to exec to a specific container so that they can investigate issues faster.
For a pod, click on "Exec" under Actions. This will open a real time, zero trust kubernetes access (ztka) shell to the running container.
Delete Pod
Useful for scenarios where the developer may need to delete a workload pod or any resource
For a workload resource, select Delete under Actions and click Yes to proceed the complete the deletion process
