Container Dashboard
The Web Console also provides users with a detailed visibility into "every container" operating in a Kubernetes pod on the cluster.
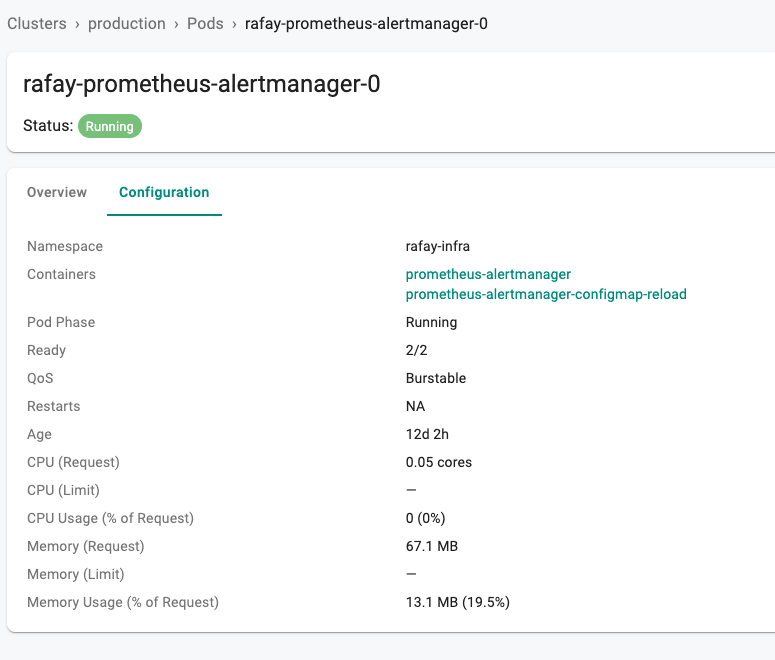
- Select a pod by clicking on its name
- Switch to Config
- Now click on the container in the pod
In the example below, the pod has two containers in it.
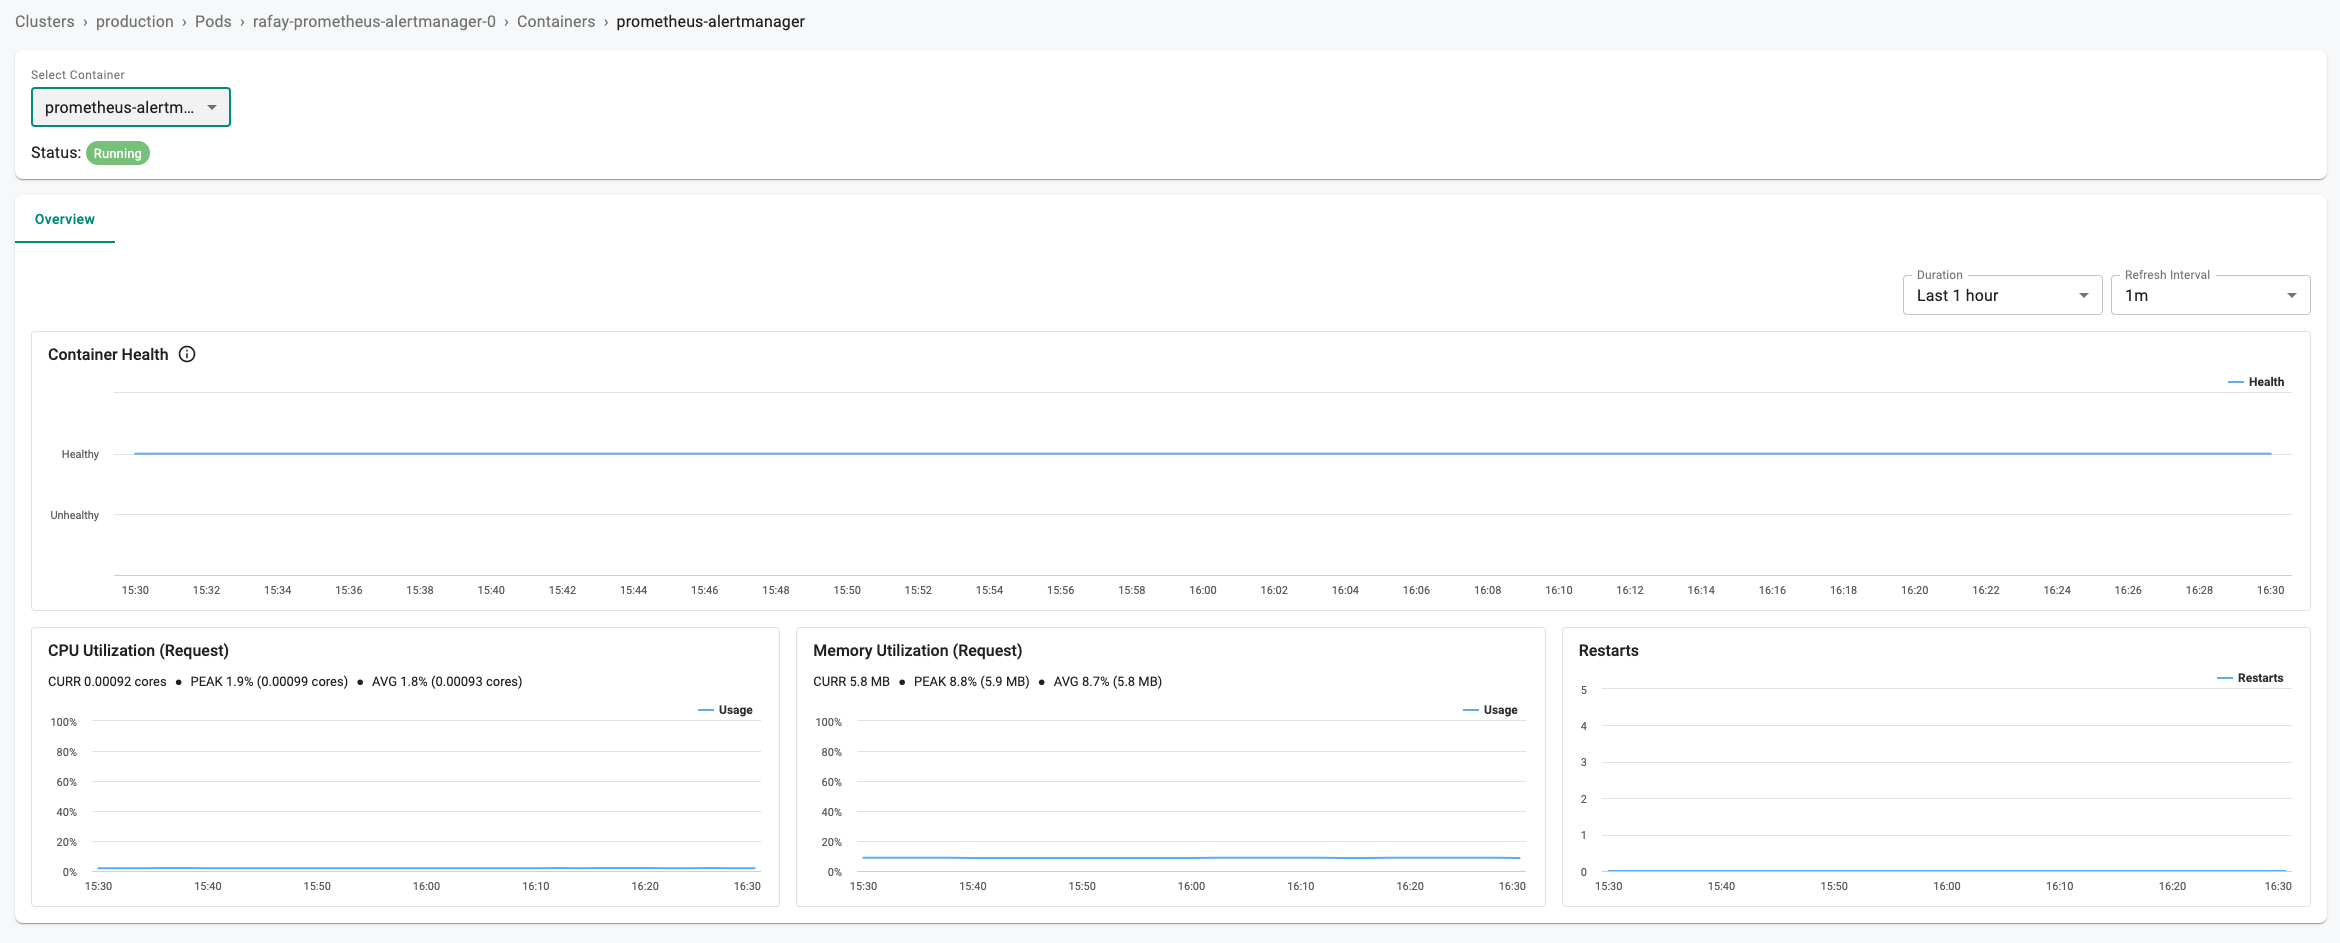
Container Dashboard
The Container Dashboard provides deep visibility into both "current state" and "long term trends".
Health
A health timeline is shown to the user providing a view into how the container has fared during the specified time period.
CPU and Memory Utilization
Users can view current and trends for CPU and Memory utilization for the specific container in the pod.
Restarts
In addition to resource (CPU and Memory) utilization trends, the user is also shown the pod restart count since the pod was scheduled on the cluster.