Organization
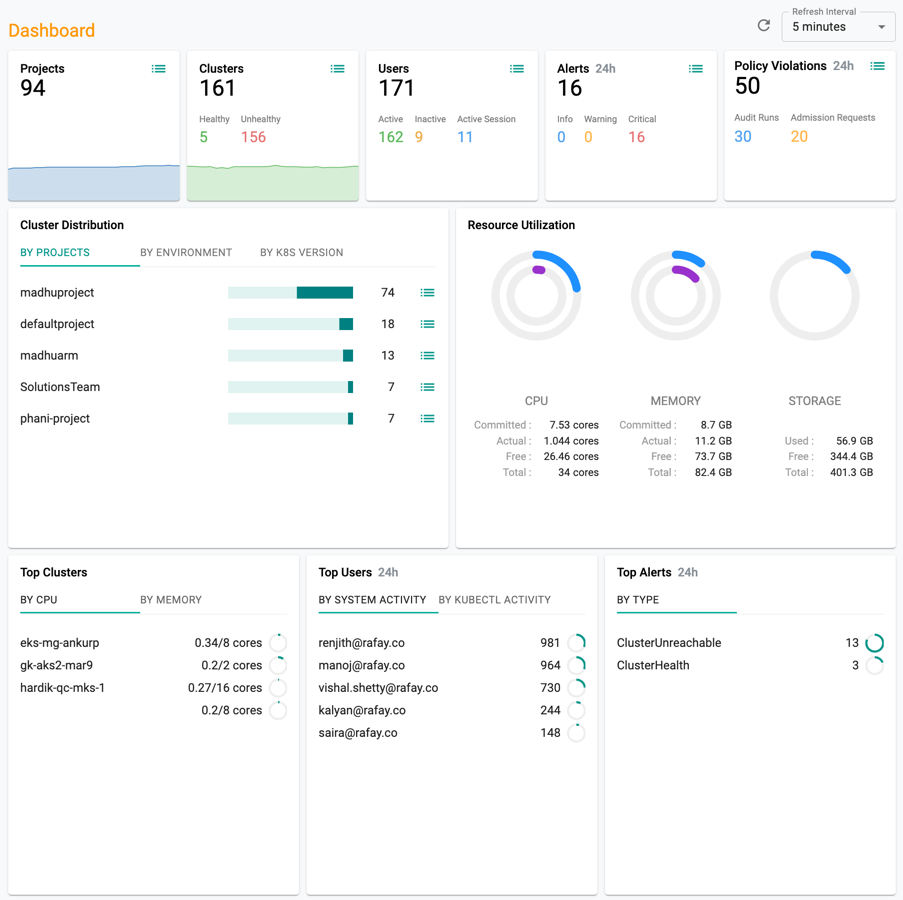
A detailed dashboard is available for every Organization (aka. Tenant) providing a "birds eye view" of all critical assets and activity spanning all projects, clusters and users. The Organization Dashboard is accessible to all users with the "Org Admin" role. An example of the Organization Dashboard is shown below.
Projects
Both the current number of Projects as well as a trend of the number of projects are shown
Clusters
The total number of Clusters currently under management as well as a trend of the number of clusters. The admin is also provided a break down by "Healthy" and "Unhealthy" Clusters.
Note
Clusters that are unreachable are not reported in the breakdown.
Users
The total number of Users that have accessed the console. The admin is also provided a break down by "Active" and "Inactive" users (Active users are those whose accounts were successfully verified by the controller). Total number of users with an "active session" are also clearly identified.
Alerts
Total number of OPEN alerts generated across the fleet of clusters over the last 24 hour time period. The alerts are presented by type (Info, Warning and Critical).
OPA Violations
Total number of policy violations for that specific organization over the last 24 hours time period.
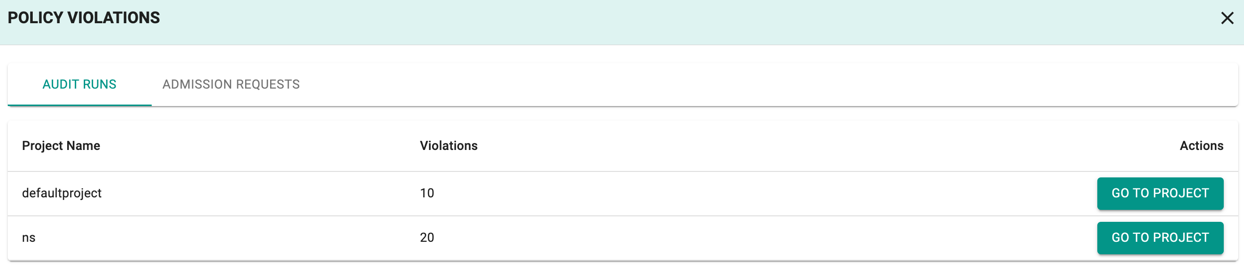
Audit Runs
Audit Runs shows the number of violations on the resources that are currently running in the clusters.
- Click on the count or View list to view the list of projects with violation(s) and the number of violations in each project
- Click Go to Project to view the list of policy violations against the selected project. This directs you to the Policy Violations page
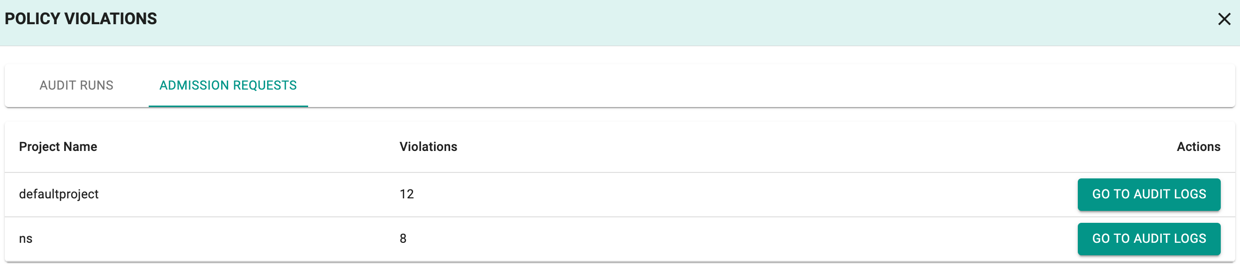
Admission Requests
Admission Requests shows the number of violations when a user attempts to create, update or delete a resource that does not comply with the configured policy on the cluster.
- Click on the count or View List to view the list of projects with violation(s) and the number of violations in each project
- Click Go to Audit Logs to view the detailed logs of the violations. This directs you to the System Audit Logs page
Important
Users with Namespace Admin role do not have access to view the Admission Requests details.
Cluster Distribution
Administrators are provided views of their org wide cluster fleet by various filters.
By Project
Get a view of cluster count by project
By Environment
Get a view of cluster count by environment (Upstream Kubernetes, Amazon EKS, Imported etc)
By Kubernetes Version
Get a view of cluster count by Kubernetes version. This can be critical for governance and can help organizations quickly prioritize which clusters need to be upgraded first.
Resource Utilization
Resource utilization for CPU, Memory and Storage across the entire cluster fleet is calculated and presented. Data is displayed by "Commits", "Actual" and "Free" clearly highlighting opportunities for tuning and optimization.
Top Clusters
The top 5 clusters under management organized by resource utilization showcasing the busiest/most utilized clusters.
By CPU
The top 5 clusters by CPU showing both "actual" utilization and "total" available cores.
By Memory
The top 5 clusters by Memory showing both "actual" utilization and "total" available memory in GB.
Top users
The top 5 clusters under management organized by user activity over the last 24 hours. This can highlight the most active users in the Organization and identify potential anomalies that may require immediate investigation.
By System Activity
Total number of unique audit entries resulting from user initiated actions (via the web console, RCTL CLI and REST API) over the last 24 hours.
By Kubectl Activity
Total number of unique audit entries resulting from user initiated actions via the zero trust kubectl channel (via both browser and Kubectl CLI) over the last 24 hours.
Top Alerts
Total number of OPEN alerts over the last 24 hours organized by Alert Type.