Sample Application
Sample Application
The next part of this exercise is to setup some services, including an Ingress for routing them.
Install Services
Set up three services: Billing, Invoice, and Comments.
-
Execute the following command to set up the services.
bash
curl -s https://docs.konghq.com/kubernetes-ingress-controller/{{page.kong_version}}/examples/001_multiple-services.yaml | kubectl apply -f -
Install Ingress for the Services
After the services are running, create Ingress routing rules in Kubernetes.
-
Execute the following command.
bash
echo '
apiVersion: networking.k8s.io/v1
kind: Ingress
metadata:
name: sample-ingresses
annotations:
    konghq.com/strip-path: "true"
spec:
ingressClassName: kong
rules:
- http:
    paths:
    - path: /billing
        pathType: ImplementationSpecific
        backend:
        service:
            name: billing
            port:
            number: 80
    - path: /comments
        pathType: ImplementationSpecific
        backend:
        service:
            name: comments
            port:
            number: 80
    - path: /invoice
        pathType: ImplementationSpecific
        backend:
        service:
            name: invoice
            port:
            number: 80
' | kubectl apply -f -
Create Some Traffic
After configuring the services and proxies, create some traffic and view the results.
-
Execute the following command. Also try adjusting the script to send different traffic patterns and see how the metrics change.
bash
while true;
do
curl http://localhost:8000/billing/status/200
curl http://localhost:8000/billing/status/501
curl http://localhost:8000/invoice/status/201
curl http://localhost:8000/invoice/status/404
curl http://localhost:8000/comments/status/200
curl http://localhost:8000/comments/status/200
sleep 0.01
done
With the Prometheus plugin enabled in Kong, it collects metrics for requests proxied via Kong. Metrics related to traffic flowing through the services should be visible in the Kong Grafana dashboard. The upstream services are httpbin instances, so a variety of endpoints can be used to shape the traffic.
Metrics Collected
Request Latencies of Services
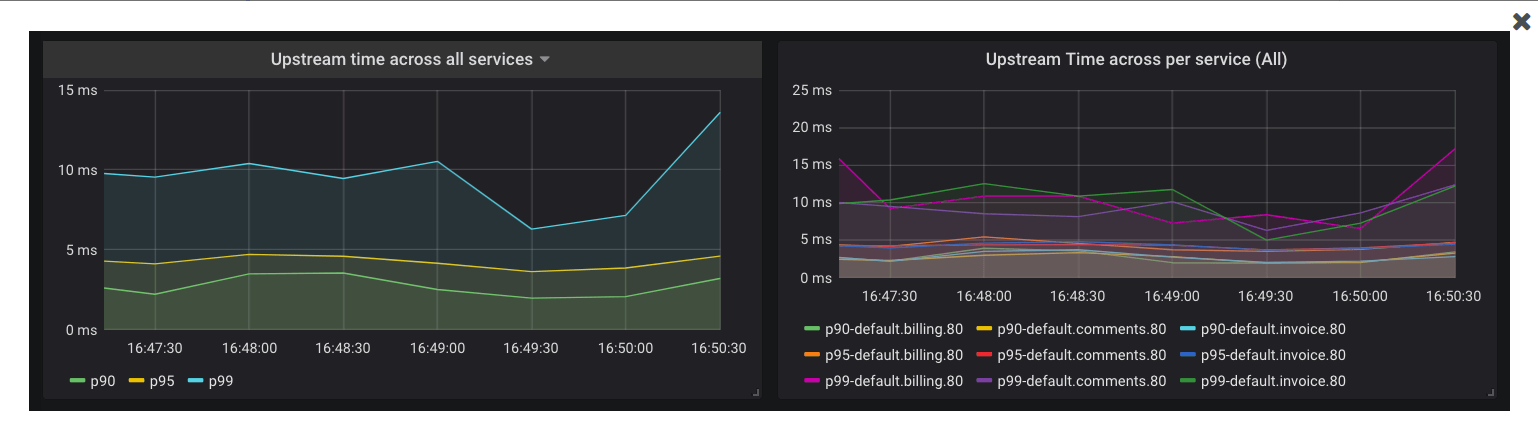
Kong collects latency data of how long a service takes to respond to requests. Data can be used to alert the on-call engineer if the latency goes beyond a certain threshold. For example, if there is an Service Level Agreement (SLA) that the APIs will respond with a latency of less than 20 milliseconds for 95% of the requests, Prometheus can be configured to alert based on the following query:
text histogram_quantile(0.95, sum(rate(kong_latency_bucket{type="request"}[1m])) by (le,service)) > 20
The query calculates the 95th percentile of the total request latency (or duration) for all of the services, and alerts if it is more than 20 milliseconds. The type label in this query is request, which tracks the latency added by Kong and the service.
Switch this to upstream to track latency added by the service only.
Prometheus is highly flexible and well documented. See the Prometheus documentation for more information about setting up alerts.
Kong Proxy Latency
Kong also collects metrics about its performance. The following query is similar to the previous, but gives insight into the latency added by Kong.
text histogram_quantile(0.90, sum(rate(kong_latency_bucket{type="kong"}[1m])) by (le,service)) > 2
Error Rates
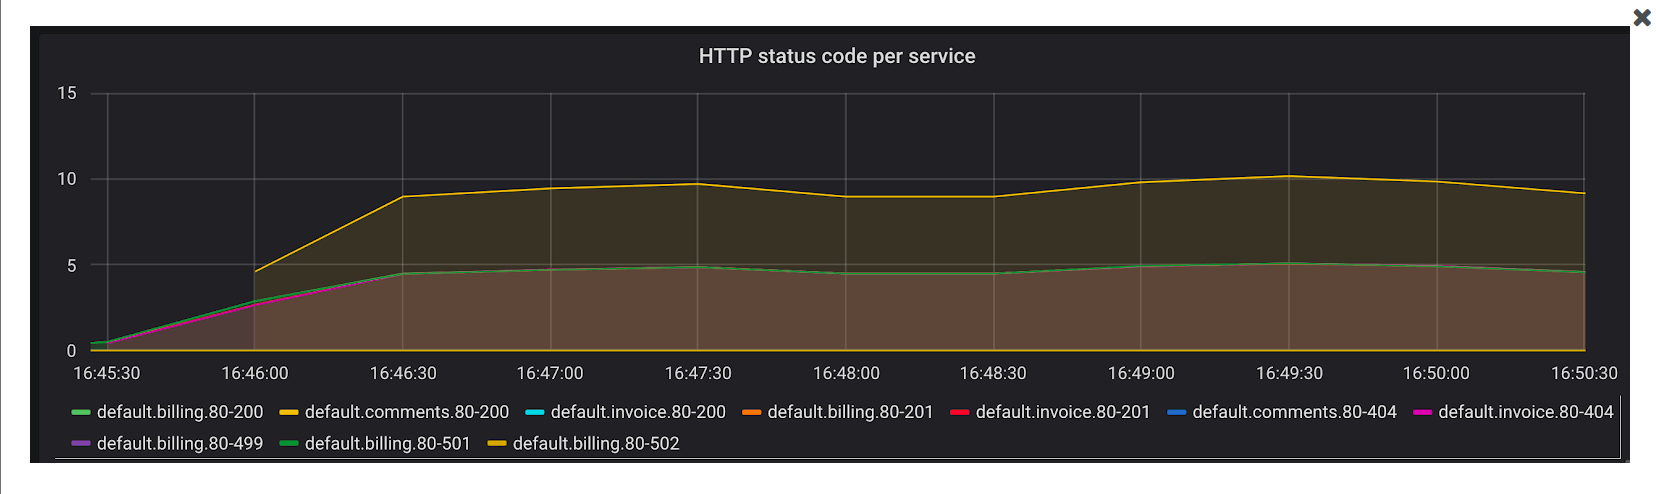
Another important metric to track is the rate of errors and requests the services are serving. The time series kong_http_status collects HTTP status code metrics for each service.
This metric helps track the rate of errors for each of the services.
text sum(rate(kong_http_status{code=~"5[0-9]{2}"}[1m])) by (service)
It is also possible to calculate the percentage of requests, in any duration, that are errors. All HTTP status codes are indexed, meaning it is possible to learn more about typical traffic patterns and identify problems. For example, a sudden rise in 404 response codes could be indicative of client codes requesting an endpoint that was removed in a recent deployment.
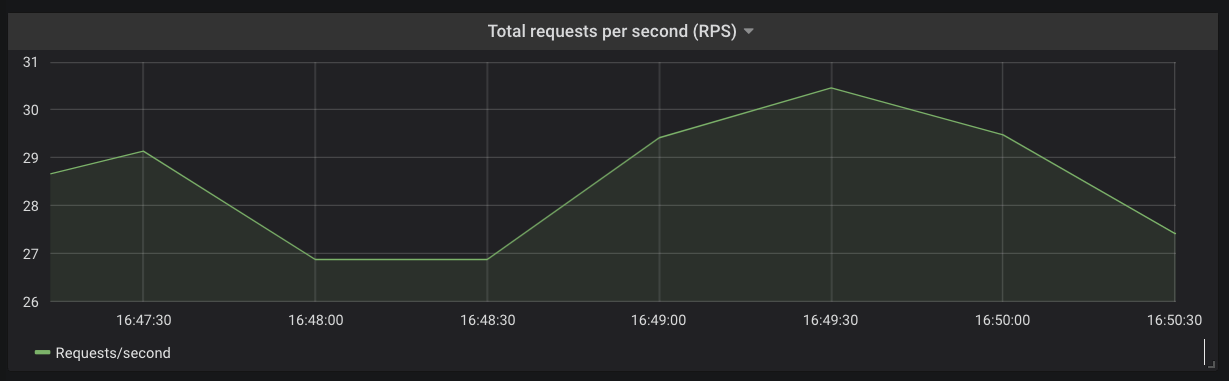
Request Rate and Bandwidth
It is possible to derive the total request rate for each of the services or across the Kubernetes cluster using the kong_http_status time series.
Another metric that Kong keeps track of is the amount of network bandwidth (kong_bandwidth) being consumed. This gives you an estimate of how request/response sizes correlate with other behaviors in your infrastructure.
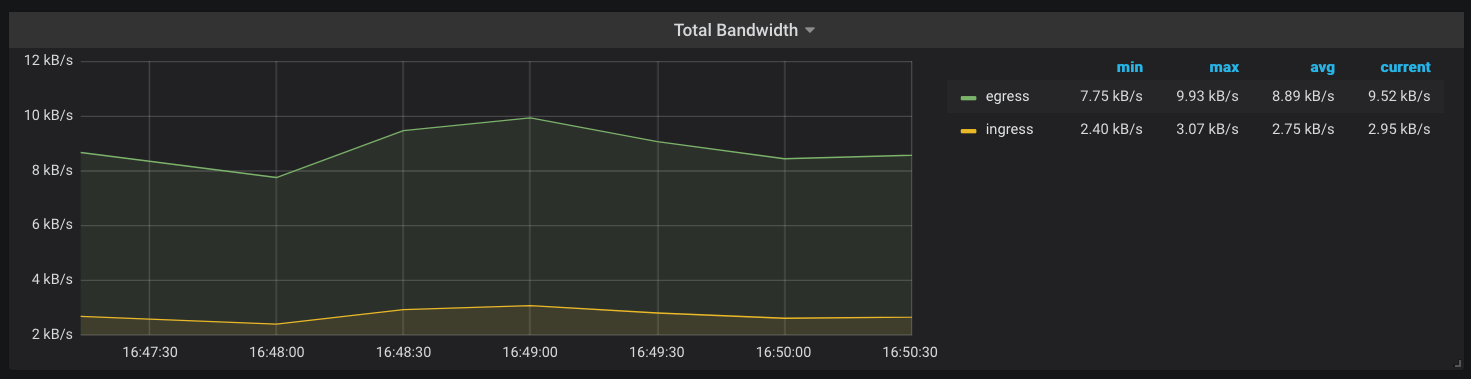
The metrics for services running inside the Kubernetes cluster is now available. This provides more visibility into the applications without making any modifications tot he services. Use Alertmanager r Grafana to configure alerts based on the metrics observed and Service Level Objectives (SLO).
Recap
Congratulations! You have successfully created a custom cluster blueprint with the "kong" addon and applied to a cluster. You can now use this blueprint on as many clusters as you require.