Dashboards
Users benefit from the integrated visibility and monitoring for their Openshift clusters. With the "default openshift" blueprint as the base blueprint, managed addons for metrics aggregation are automatically deployed to the Openshift clusters. Metrics are scraped and aggregated in a centralized time series database and presented to users via intuitive dashboards.
Note
Some illustrative examples of dashboards shown below. Available dashboards are identical to that of other cluster types providing users with a consistent experience for heterogeneous environments.
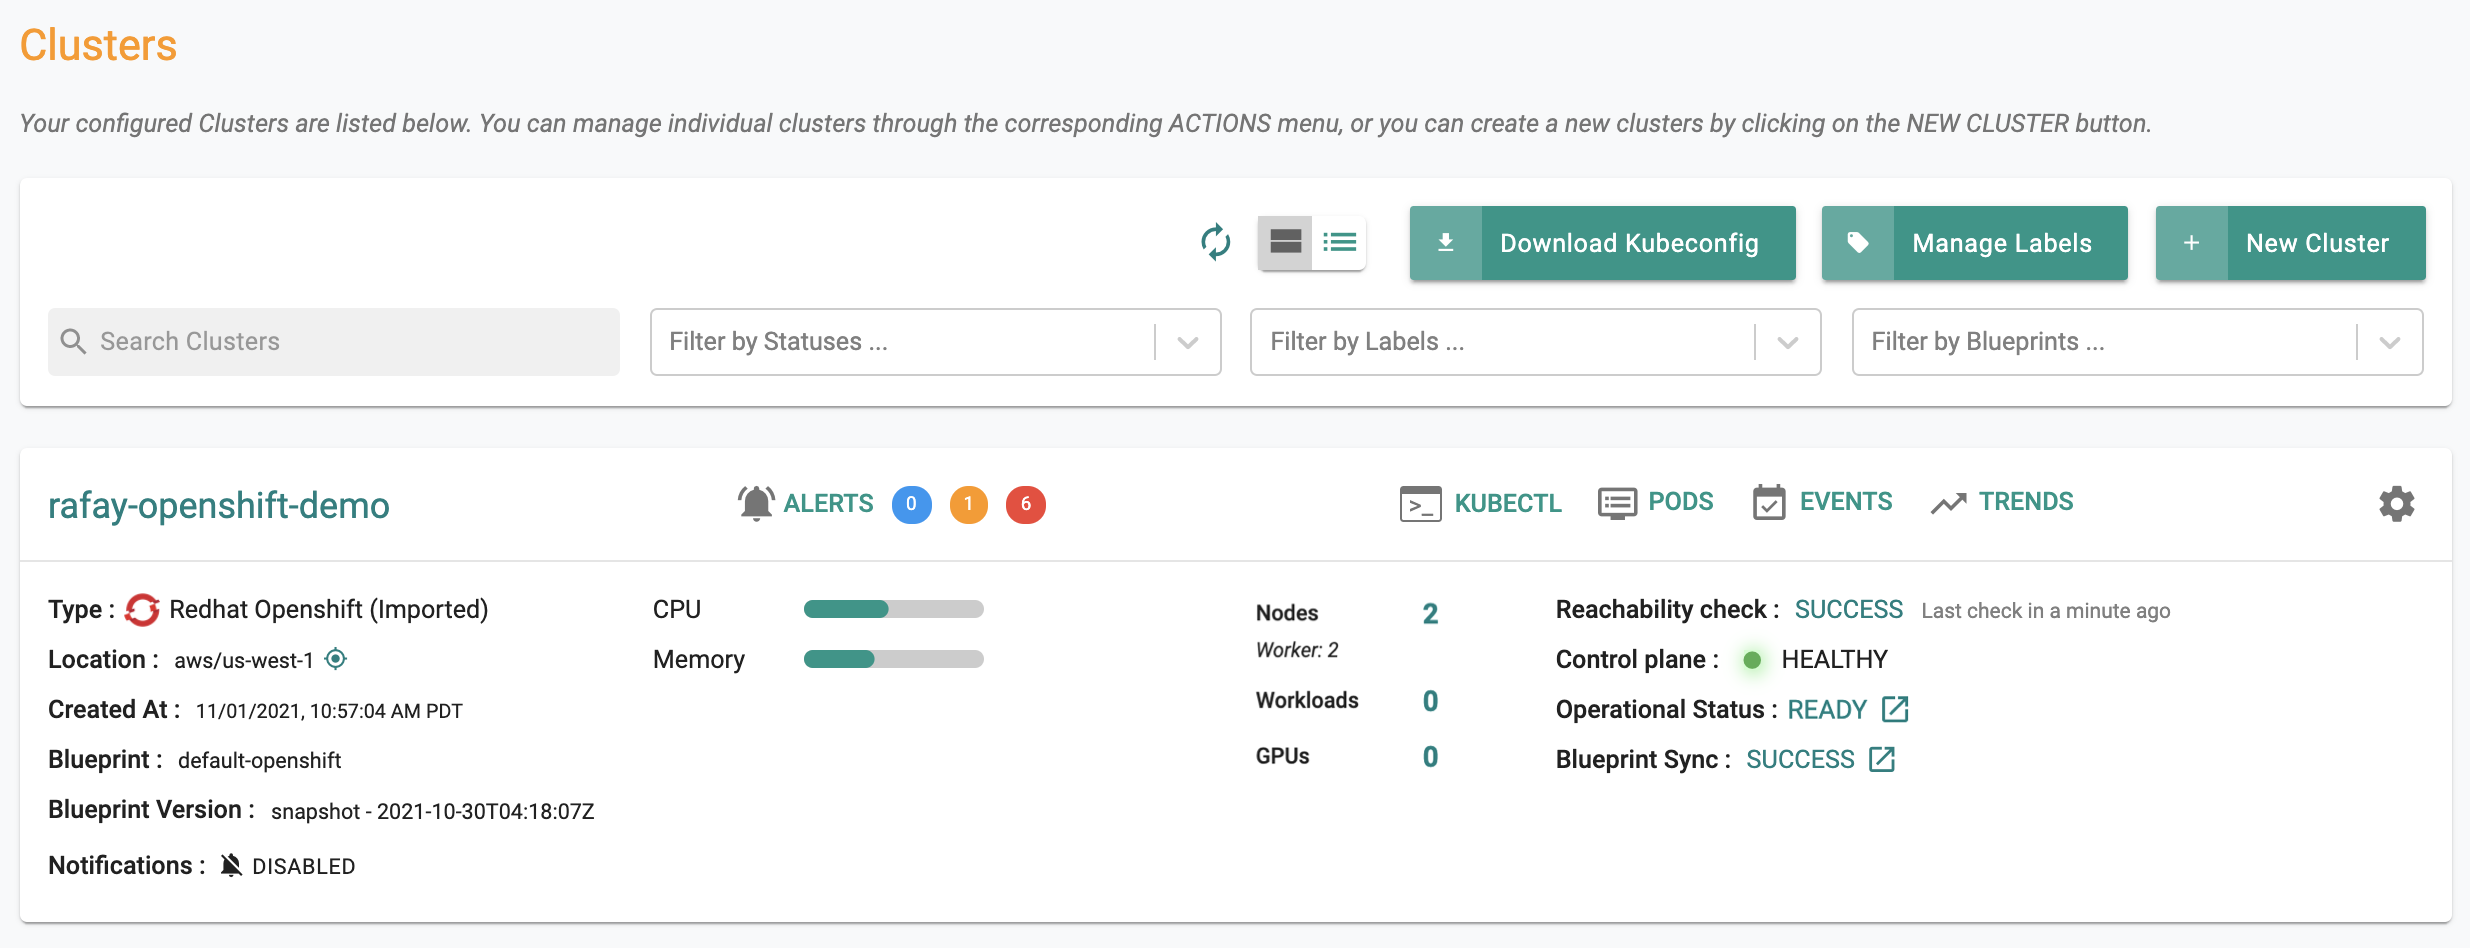
Cluster Dashboard
The cluster dashboard provides a bird's eye view of the Openshift Cluster.
Node Dashboard
The Node dashboard provides a view of all the nodes in the Openshift Cluster.
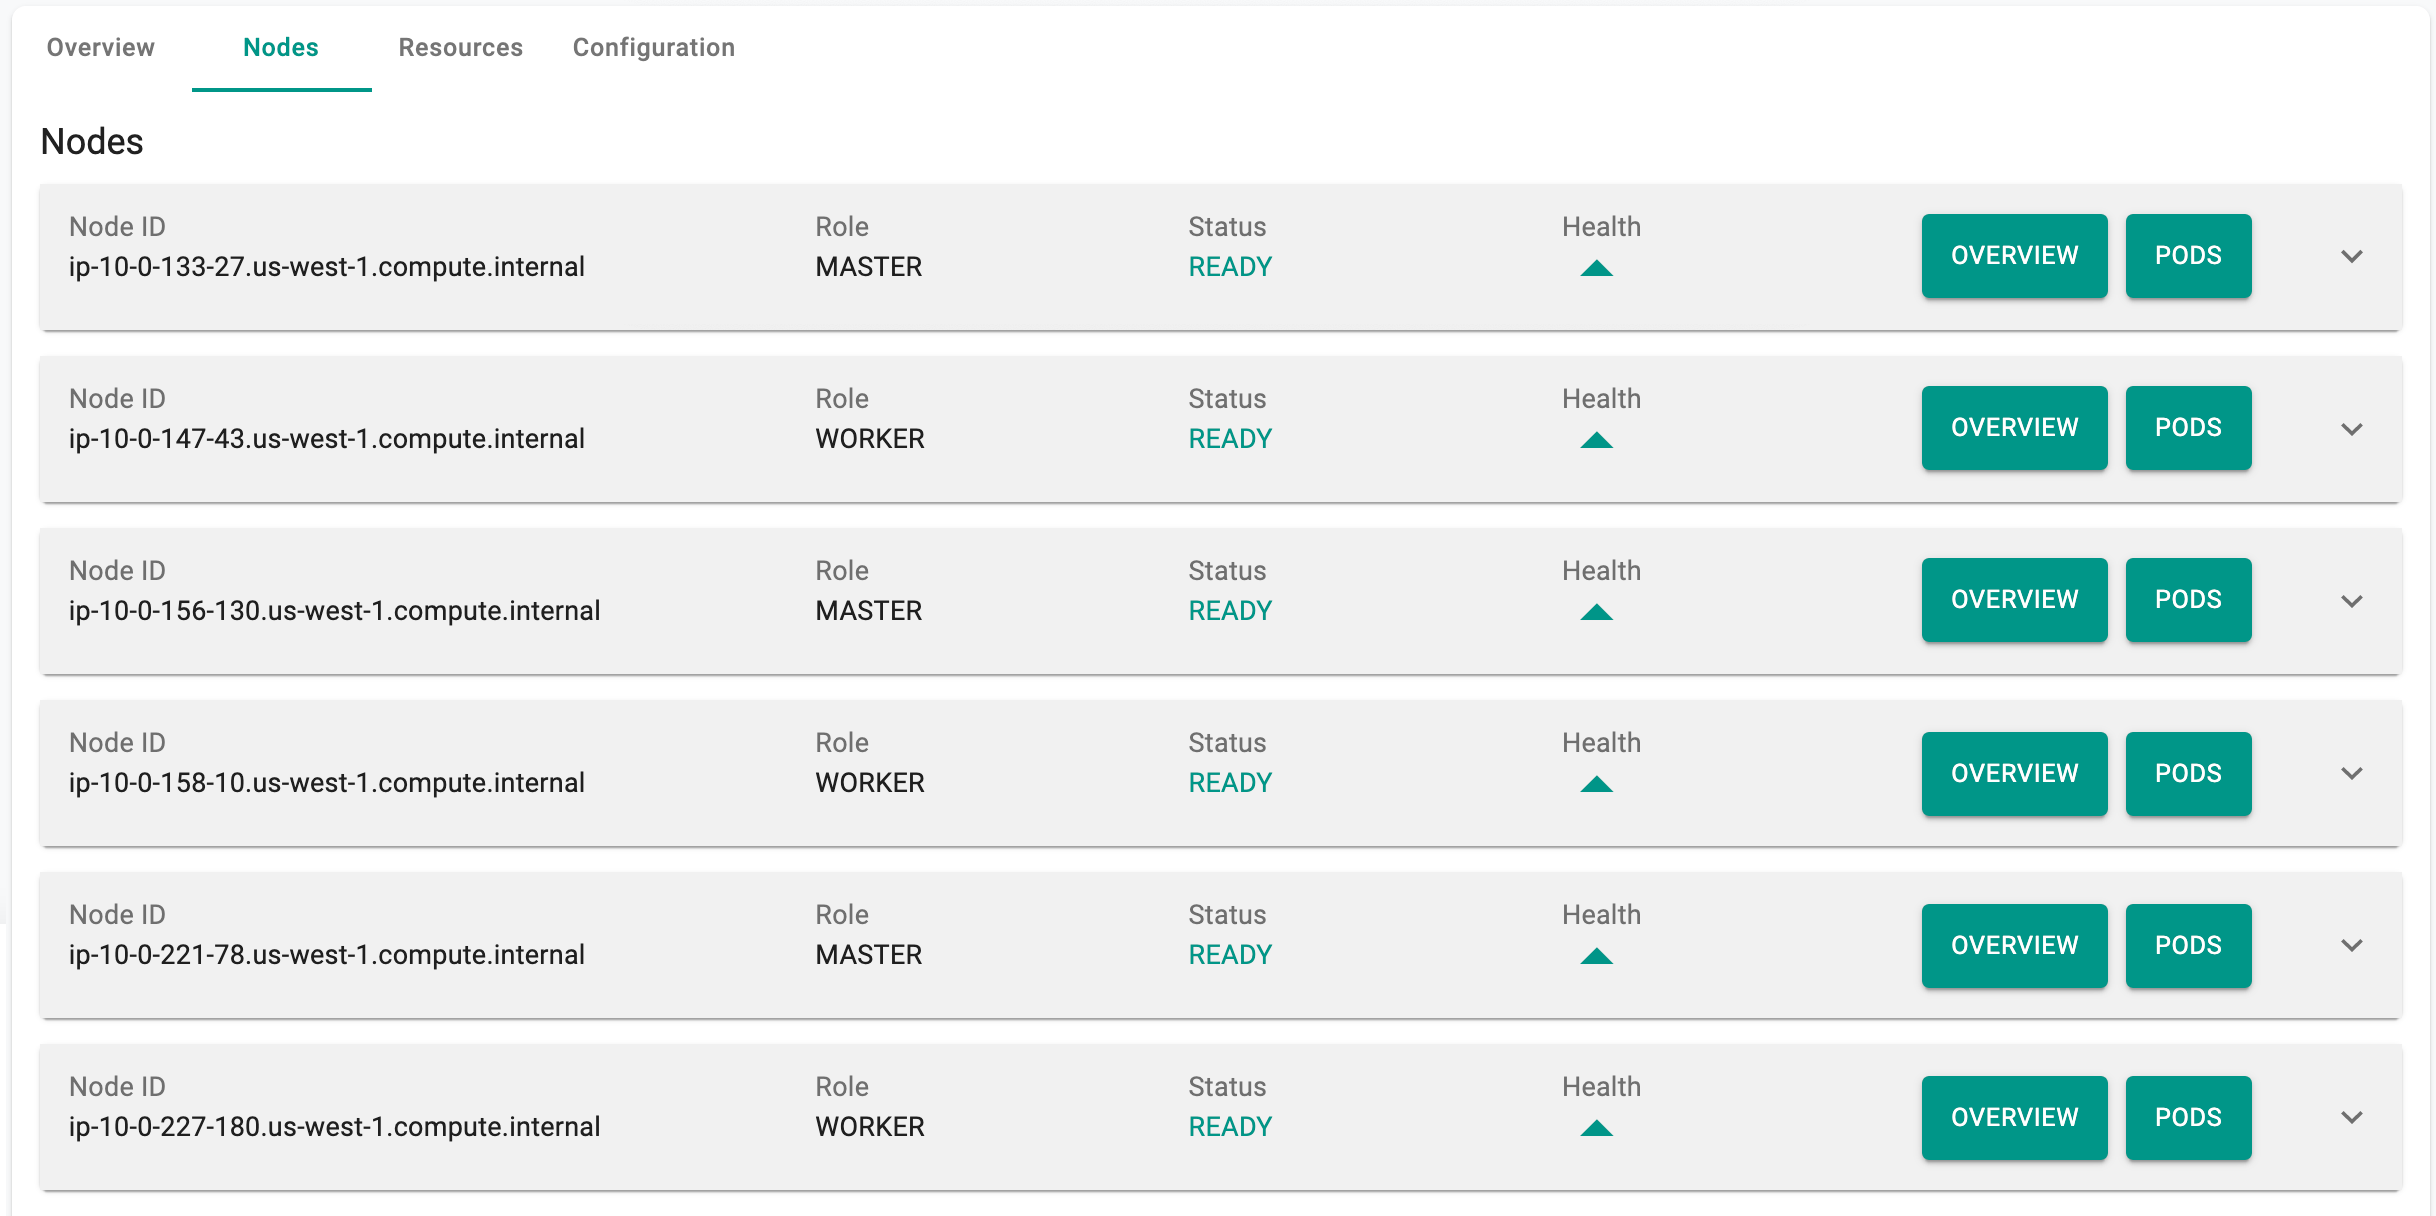
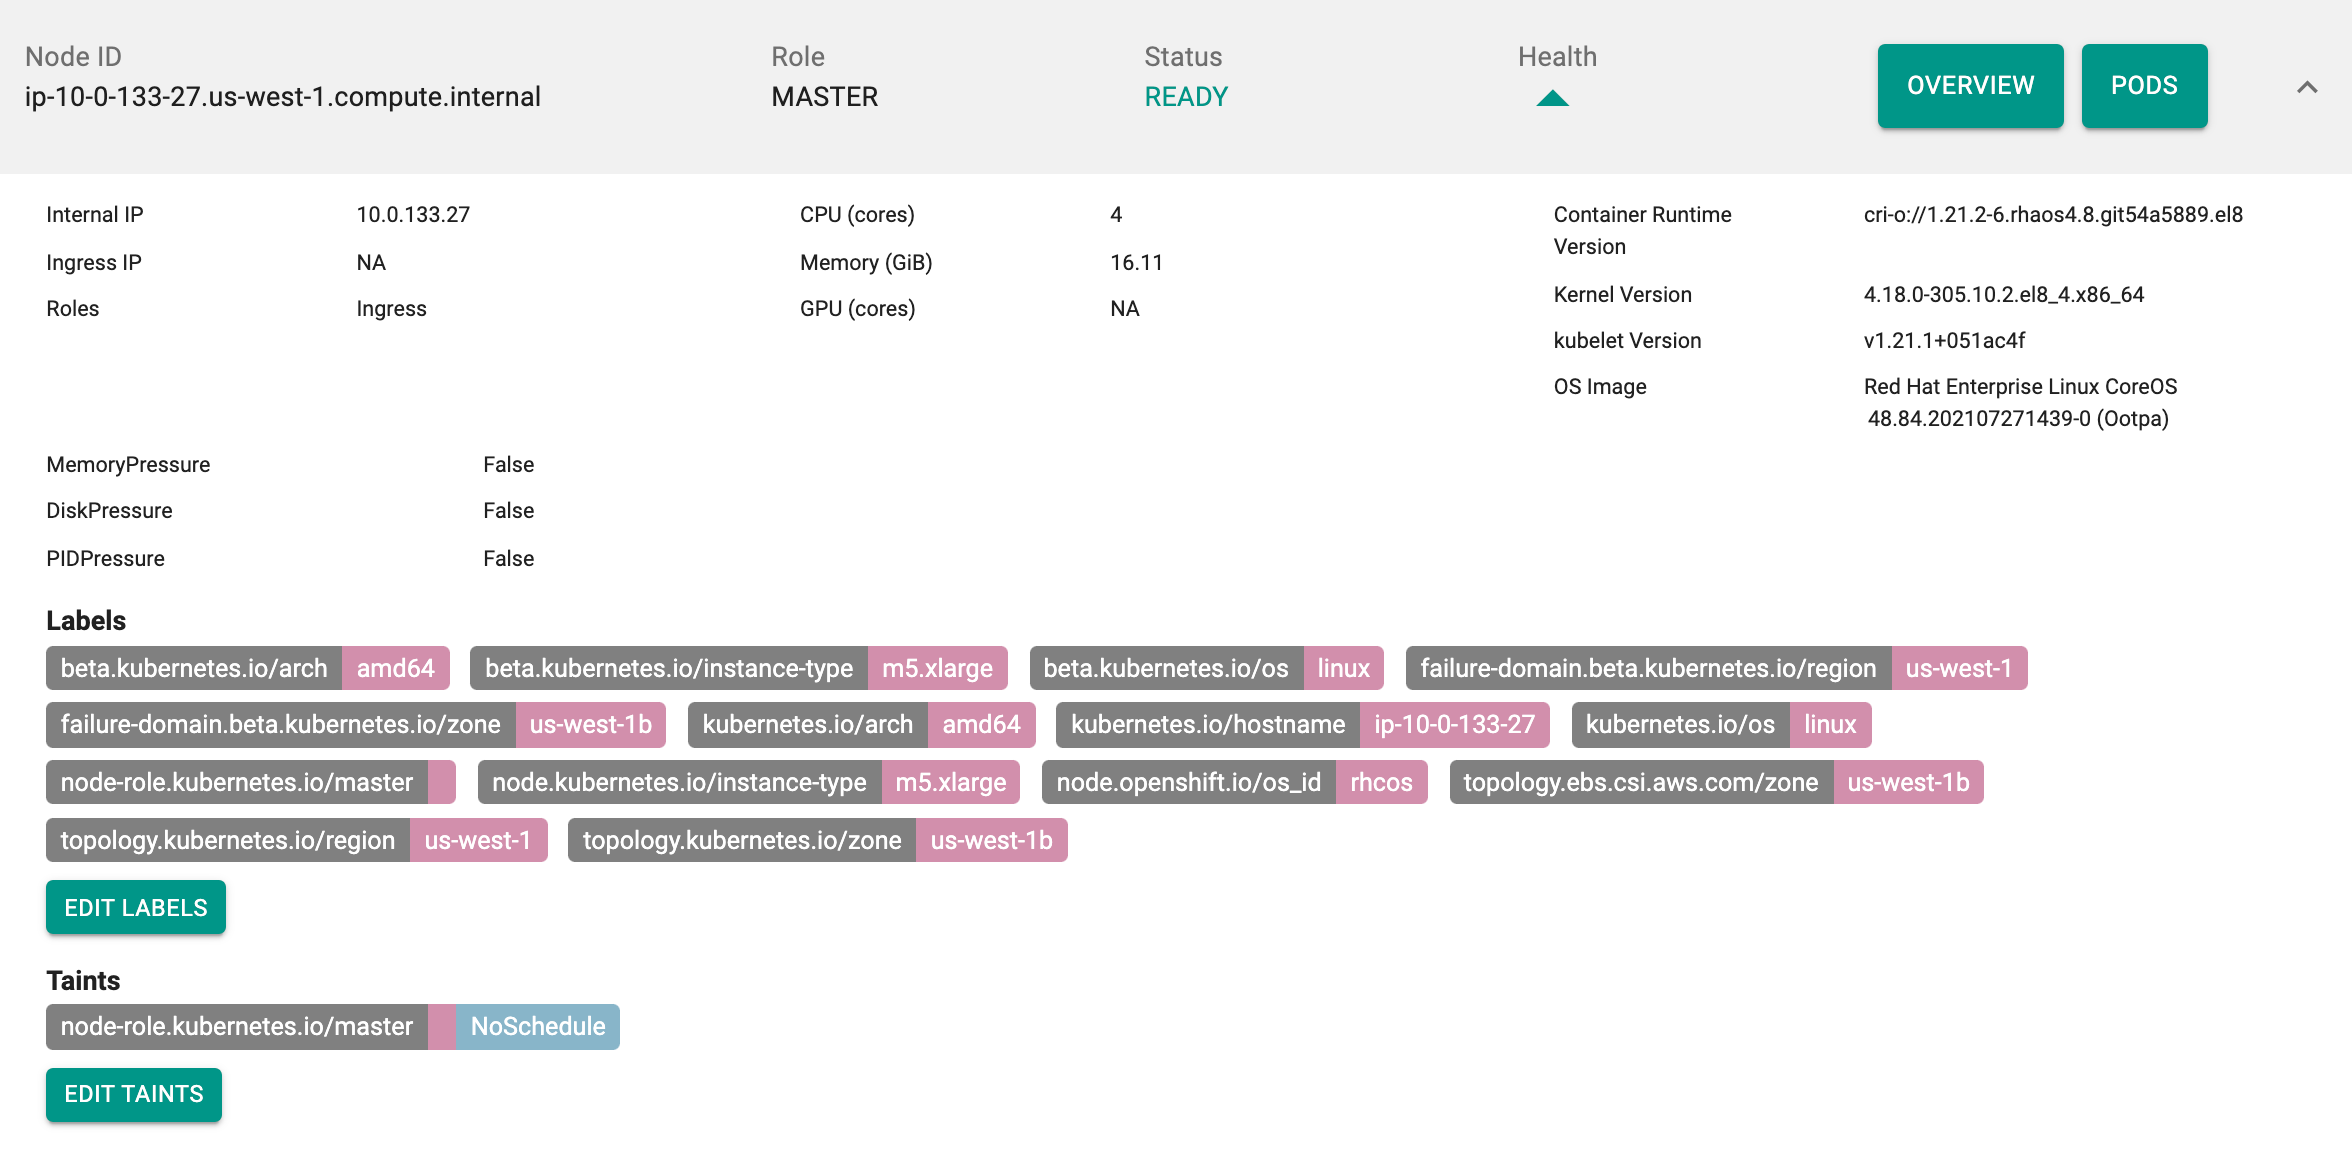
Click on "Overview" to view the dashboard for a specific node.
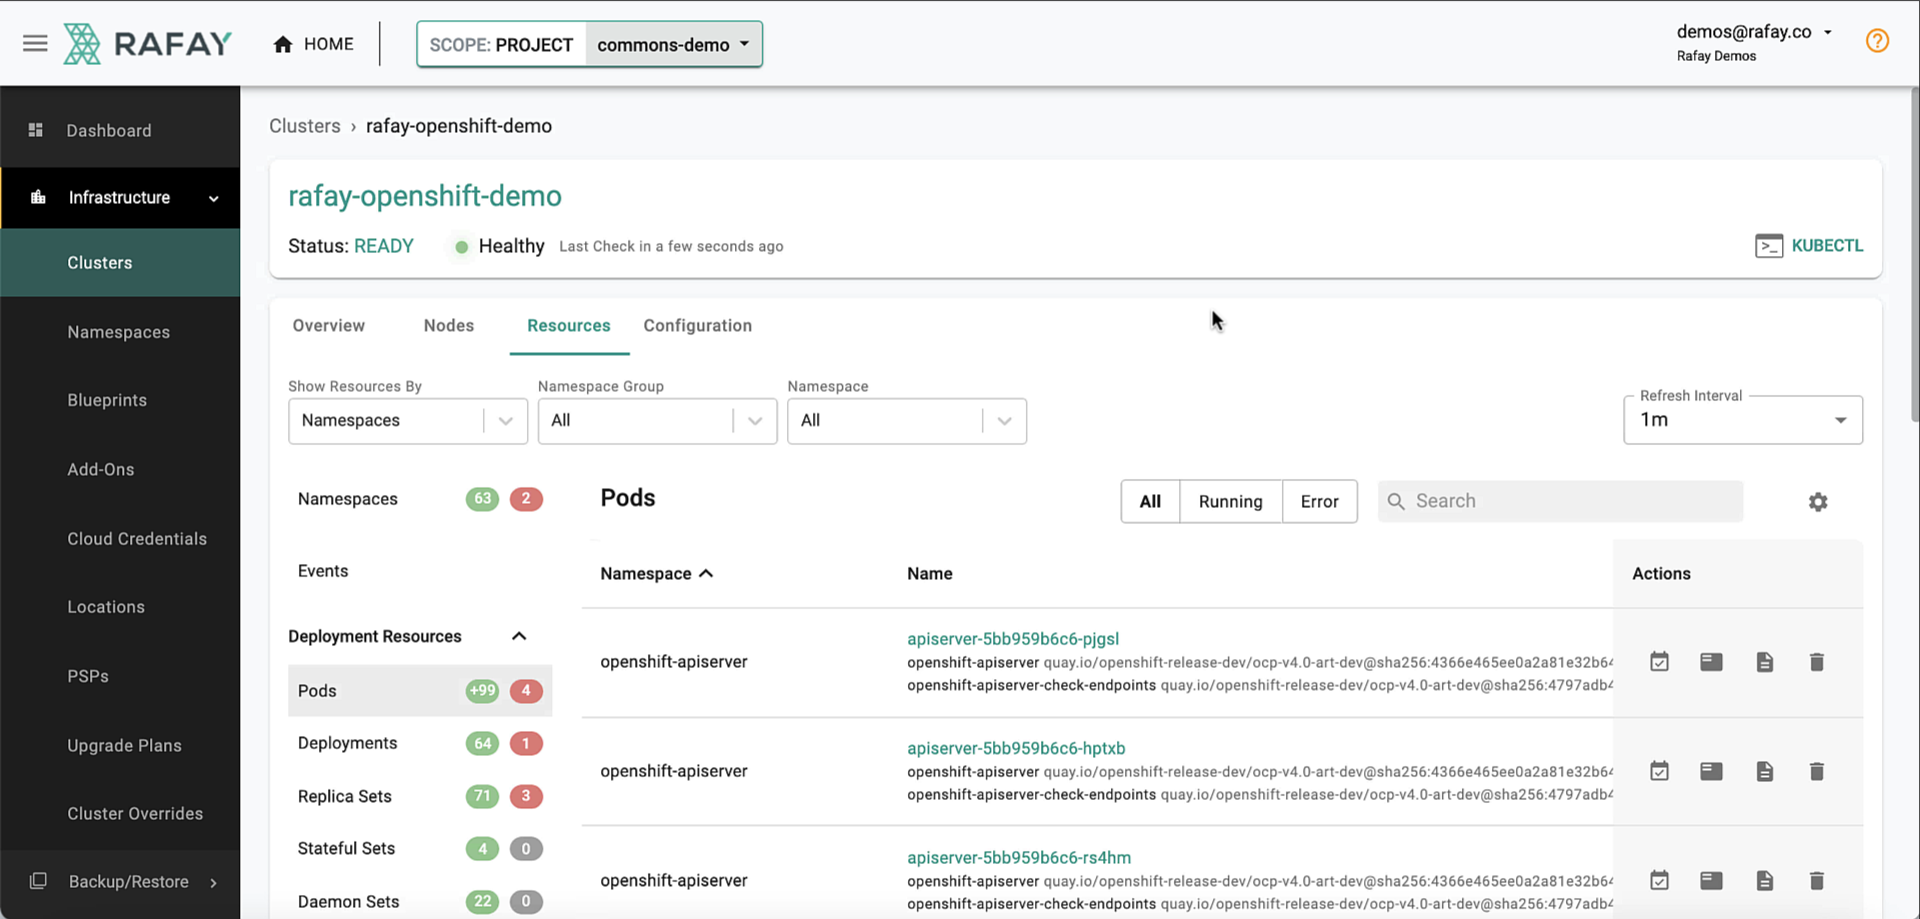
k8s Resources
Users can use the integrated Kubernetes resources dashboard to view all the resources organized by namespaces in the Openshift cluster. In addition to viewing the resources, users can also perform actions on k8s resources operating on remote Openshift clusters.