Cluster
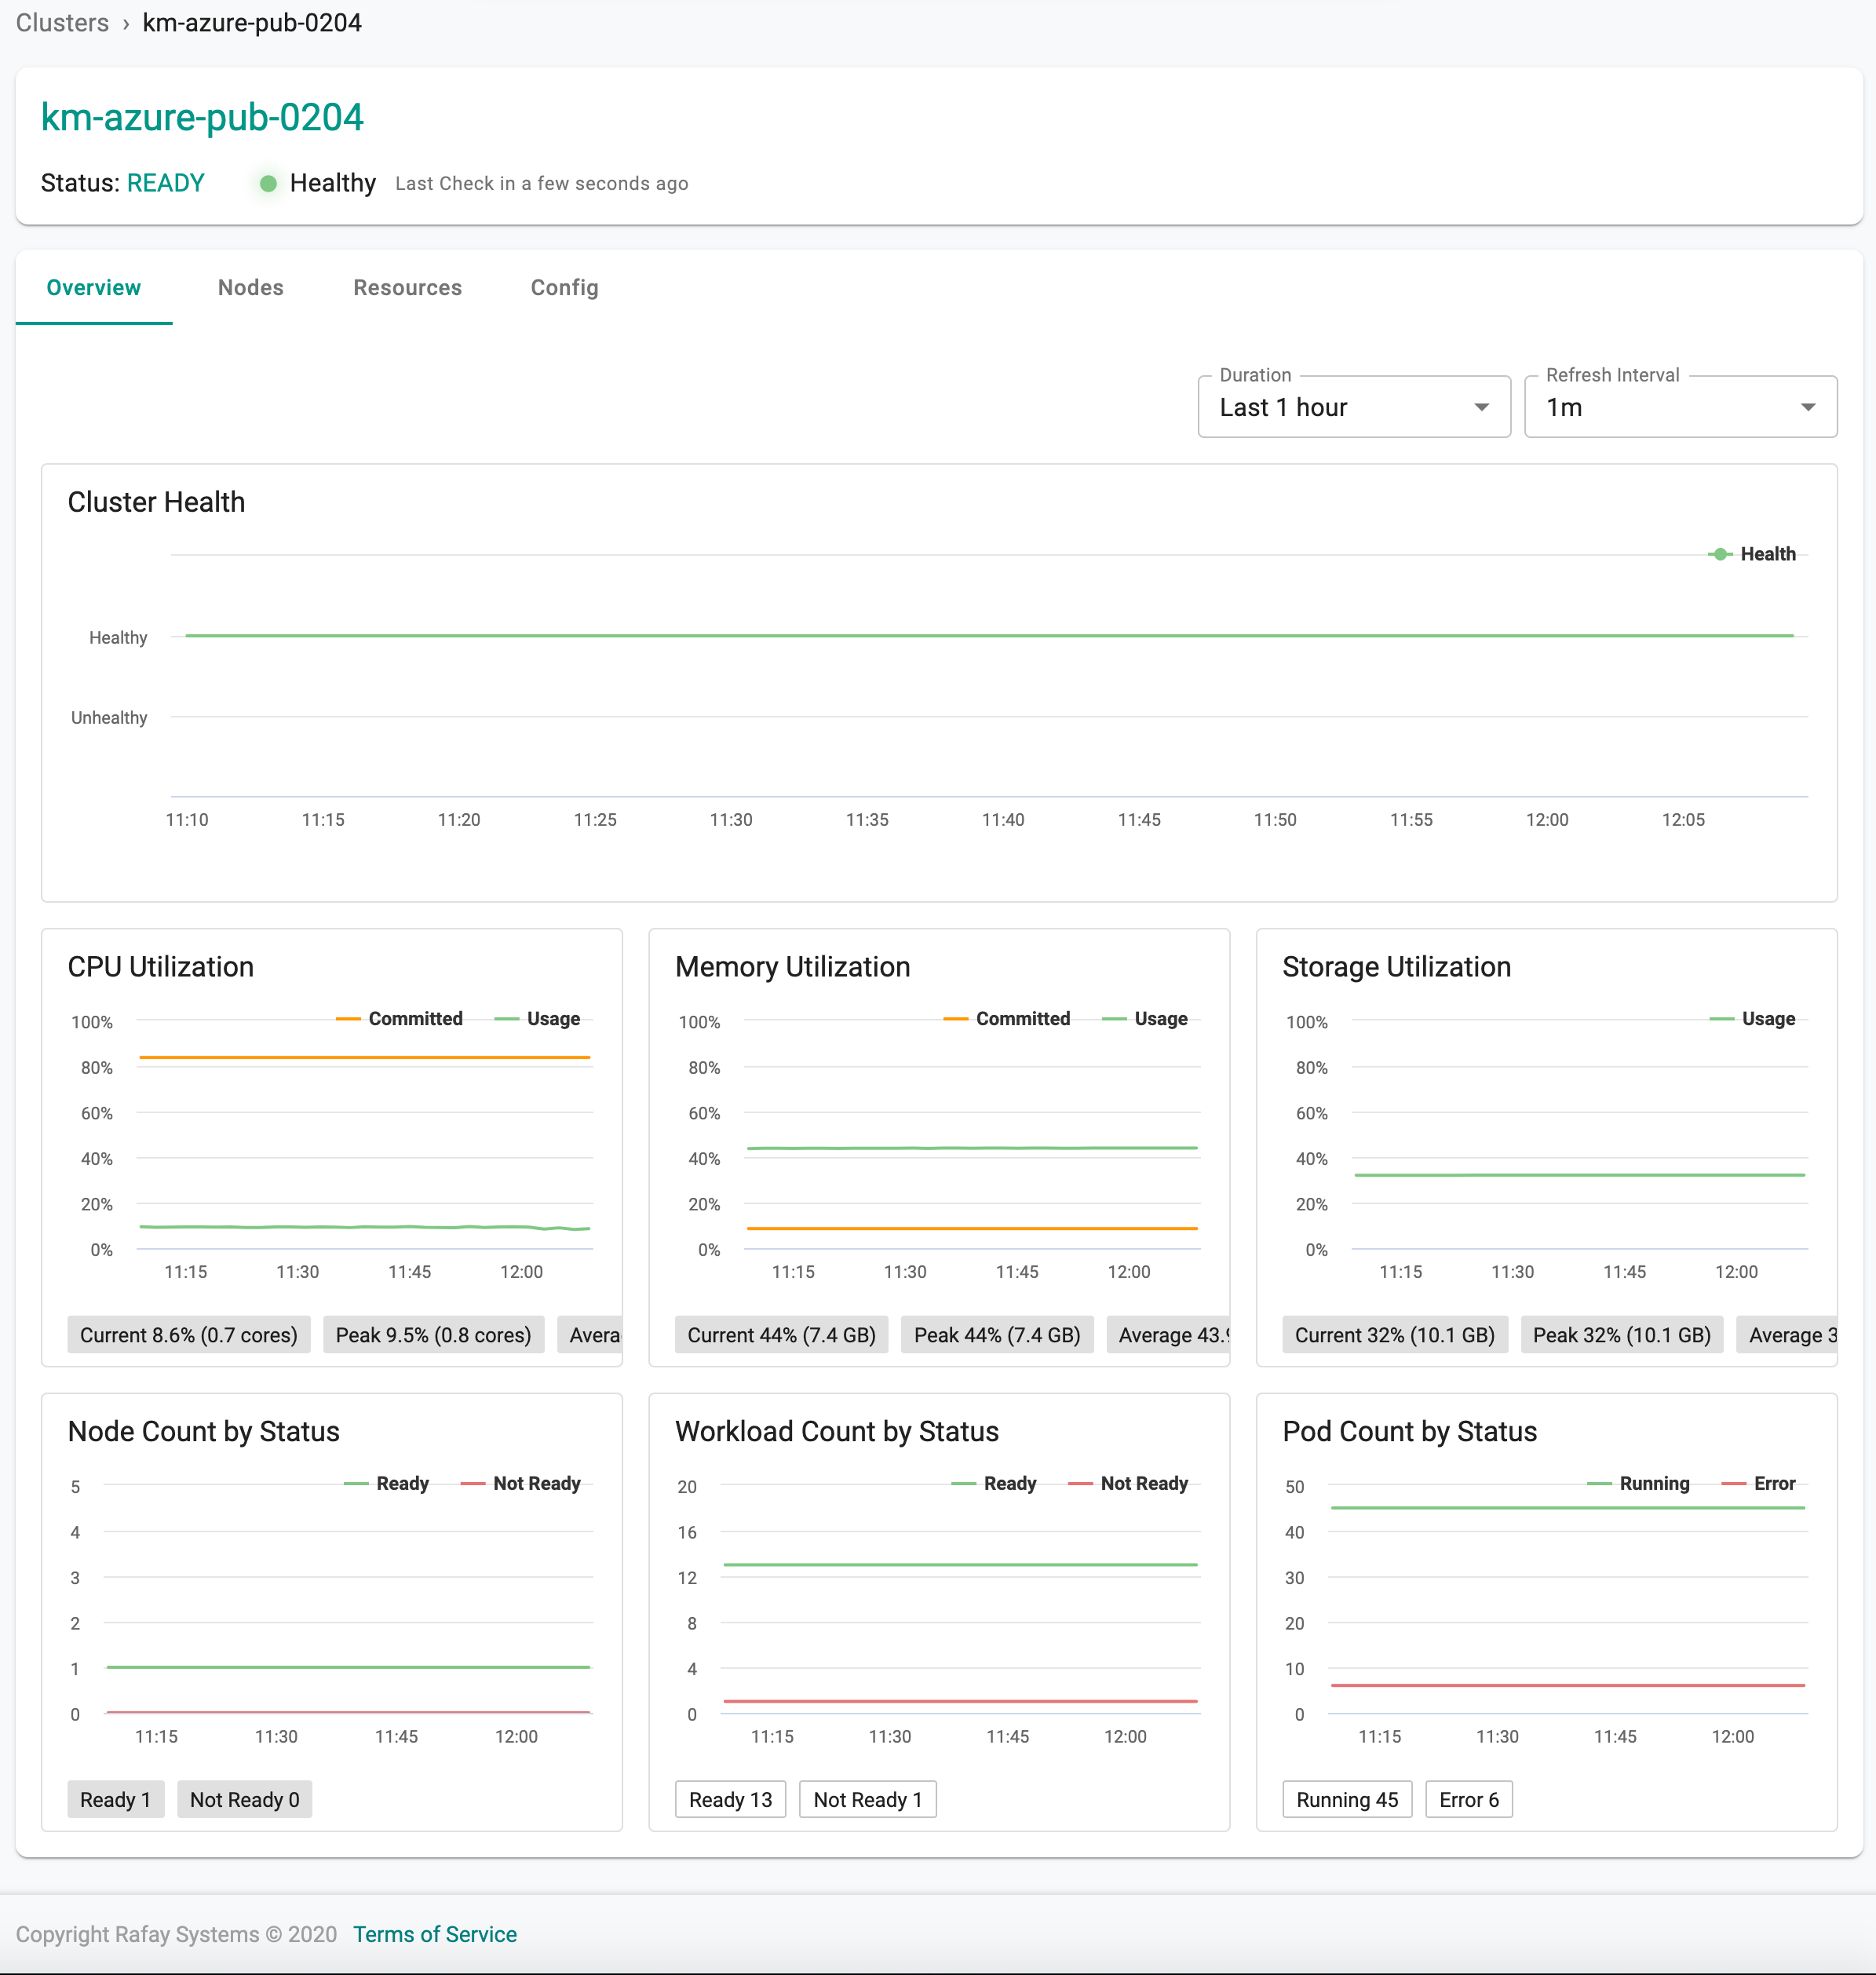
A detailed dashboard is available for every managed cluster. The cluster dashboard provides at a glance information such as insight into health, resource utilization and status of pods and workloads.
The management addons transmit this data periodically back to the Controller and is used to power all the dashboards.
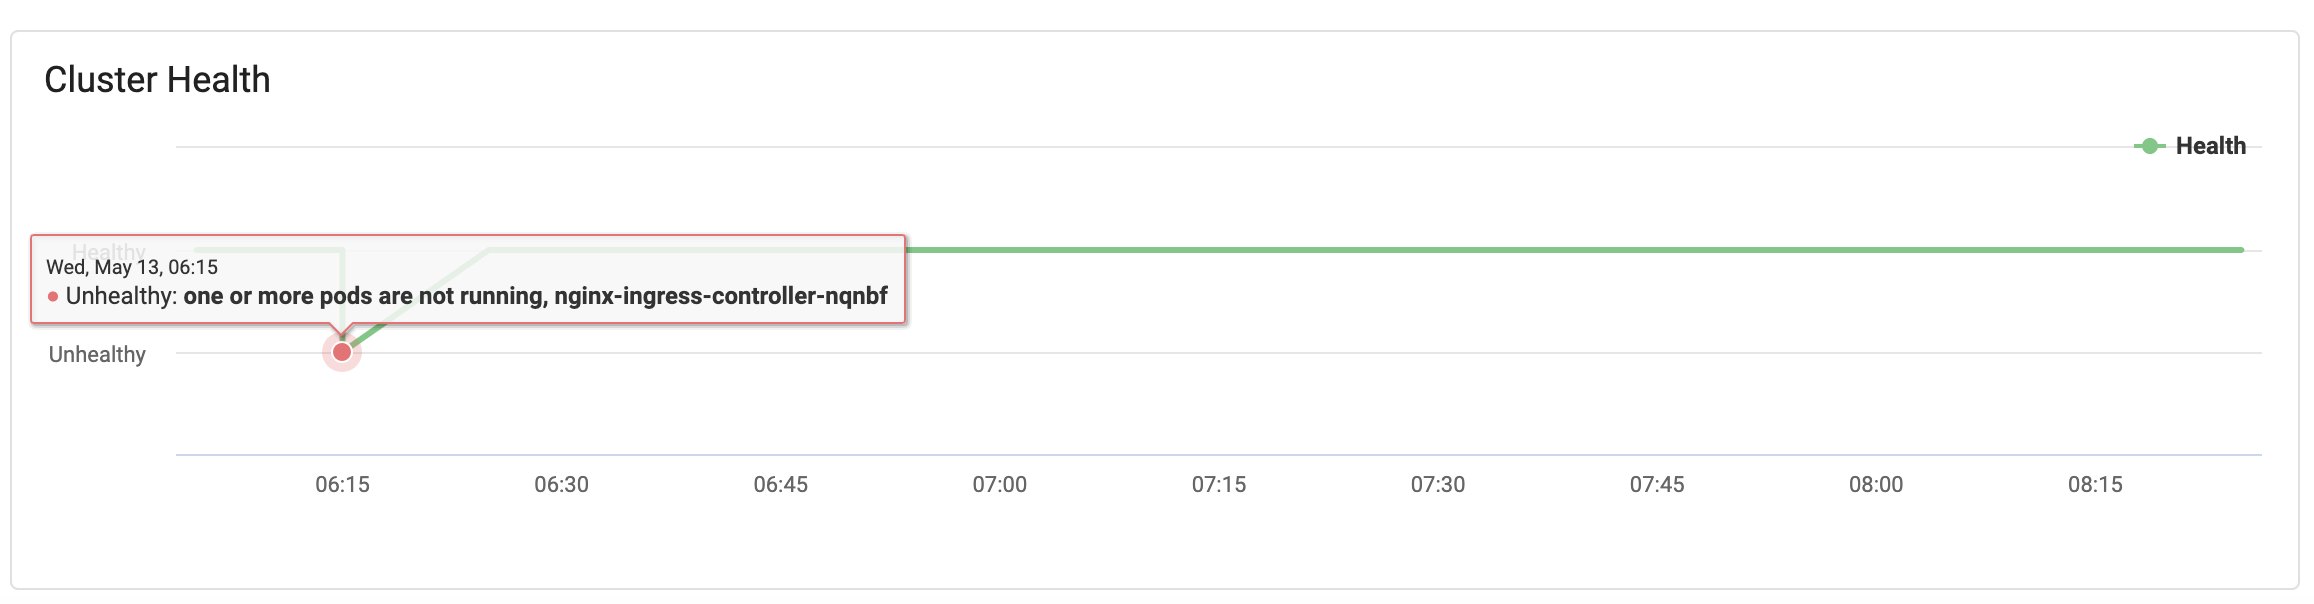
Cluster Health
The Controller continuously monitors the health of all managed clusters. Users are provided with a timeline view of cluster health. They can use this to quickly determine "when" and "how long" their clusters were unhealthy.
In the example below, the timeline shows that the cluster was unhealthy for a brief time period due to an issue with the Ingress Controller.
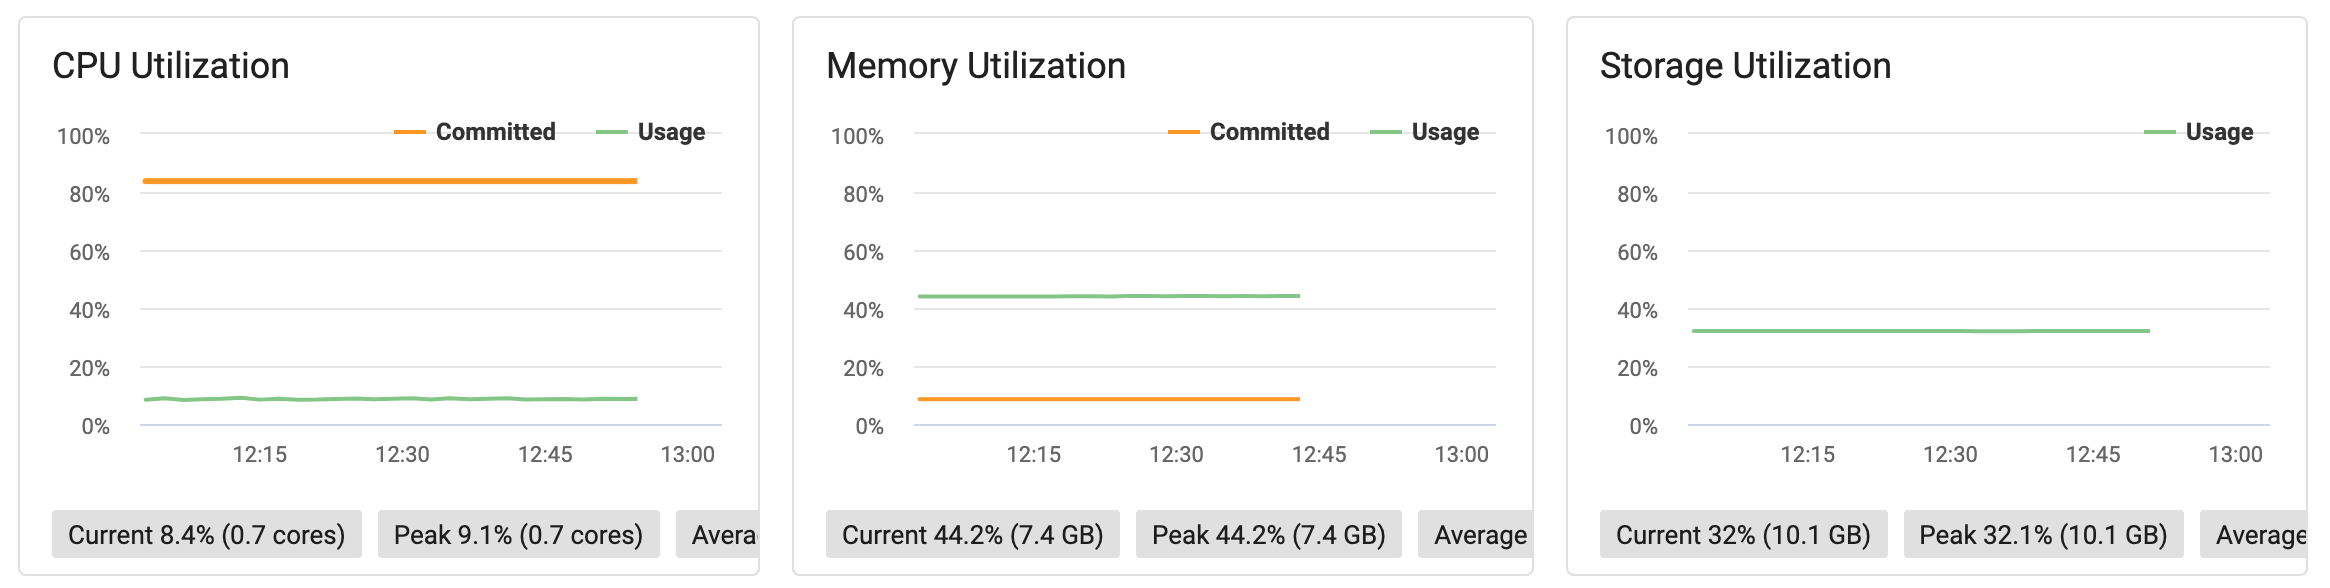
Resource Utilization
Resource utilization trends for CPU, Memory and Storage over time are presented organized by "Committed" and "Actual Usage".
This information is critical for infrastructure admins to determine if the clusters are resourced properly or not. They can also use this data to make capacity planning decisions.
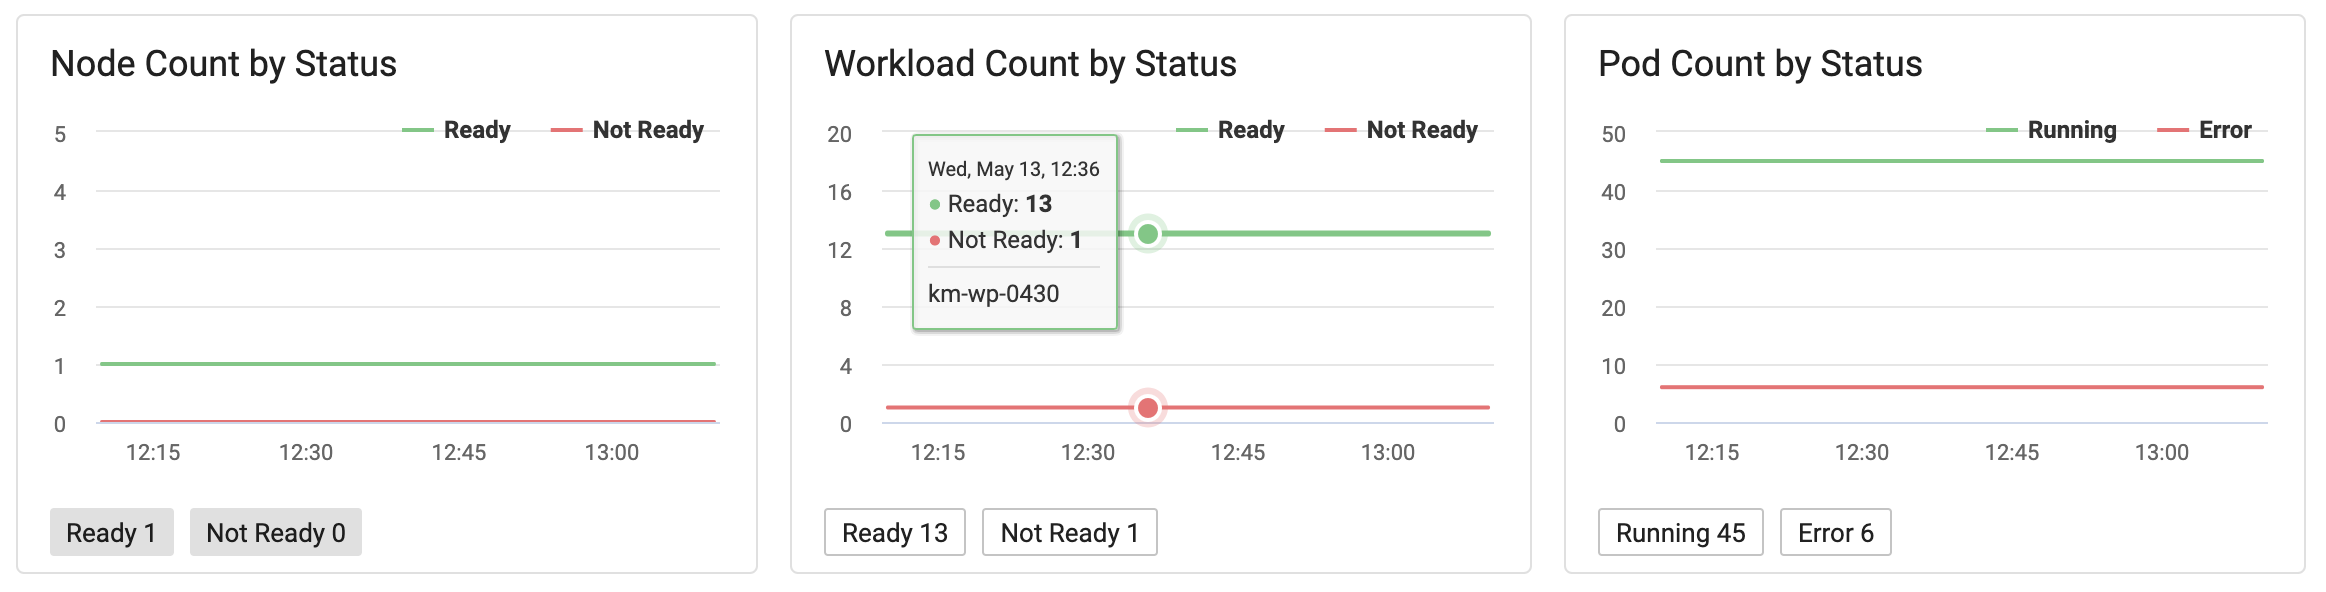
Status and Count
A timeline of status and count of "nodes", "workloads" and "number of pods" on the cluster is also available.
Infrastructure admins can use this to quickly determine when new nodes were added and removed from the cluster. They can also determine how many pods are operating on the cluster over a time period.