Alerts
What You Will Do
This is Part 1 of a multi-part, self-paced quick start exercise. In this part, you will create a custom blueprint and apply it on your cluster. Next you will simulate an error condition on your cluster to see how the platform monitors, generates and centrally aggregates alerts.
Step 1: Create Blueprint
- Navigate to the project in your Org where the cluster is located.
- Select Infrastructure -> Blueprint -> New Blueprint
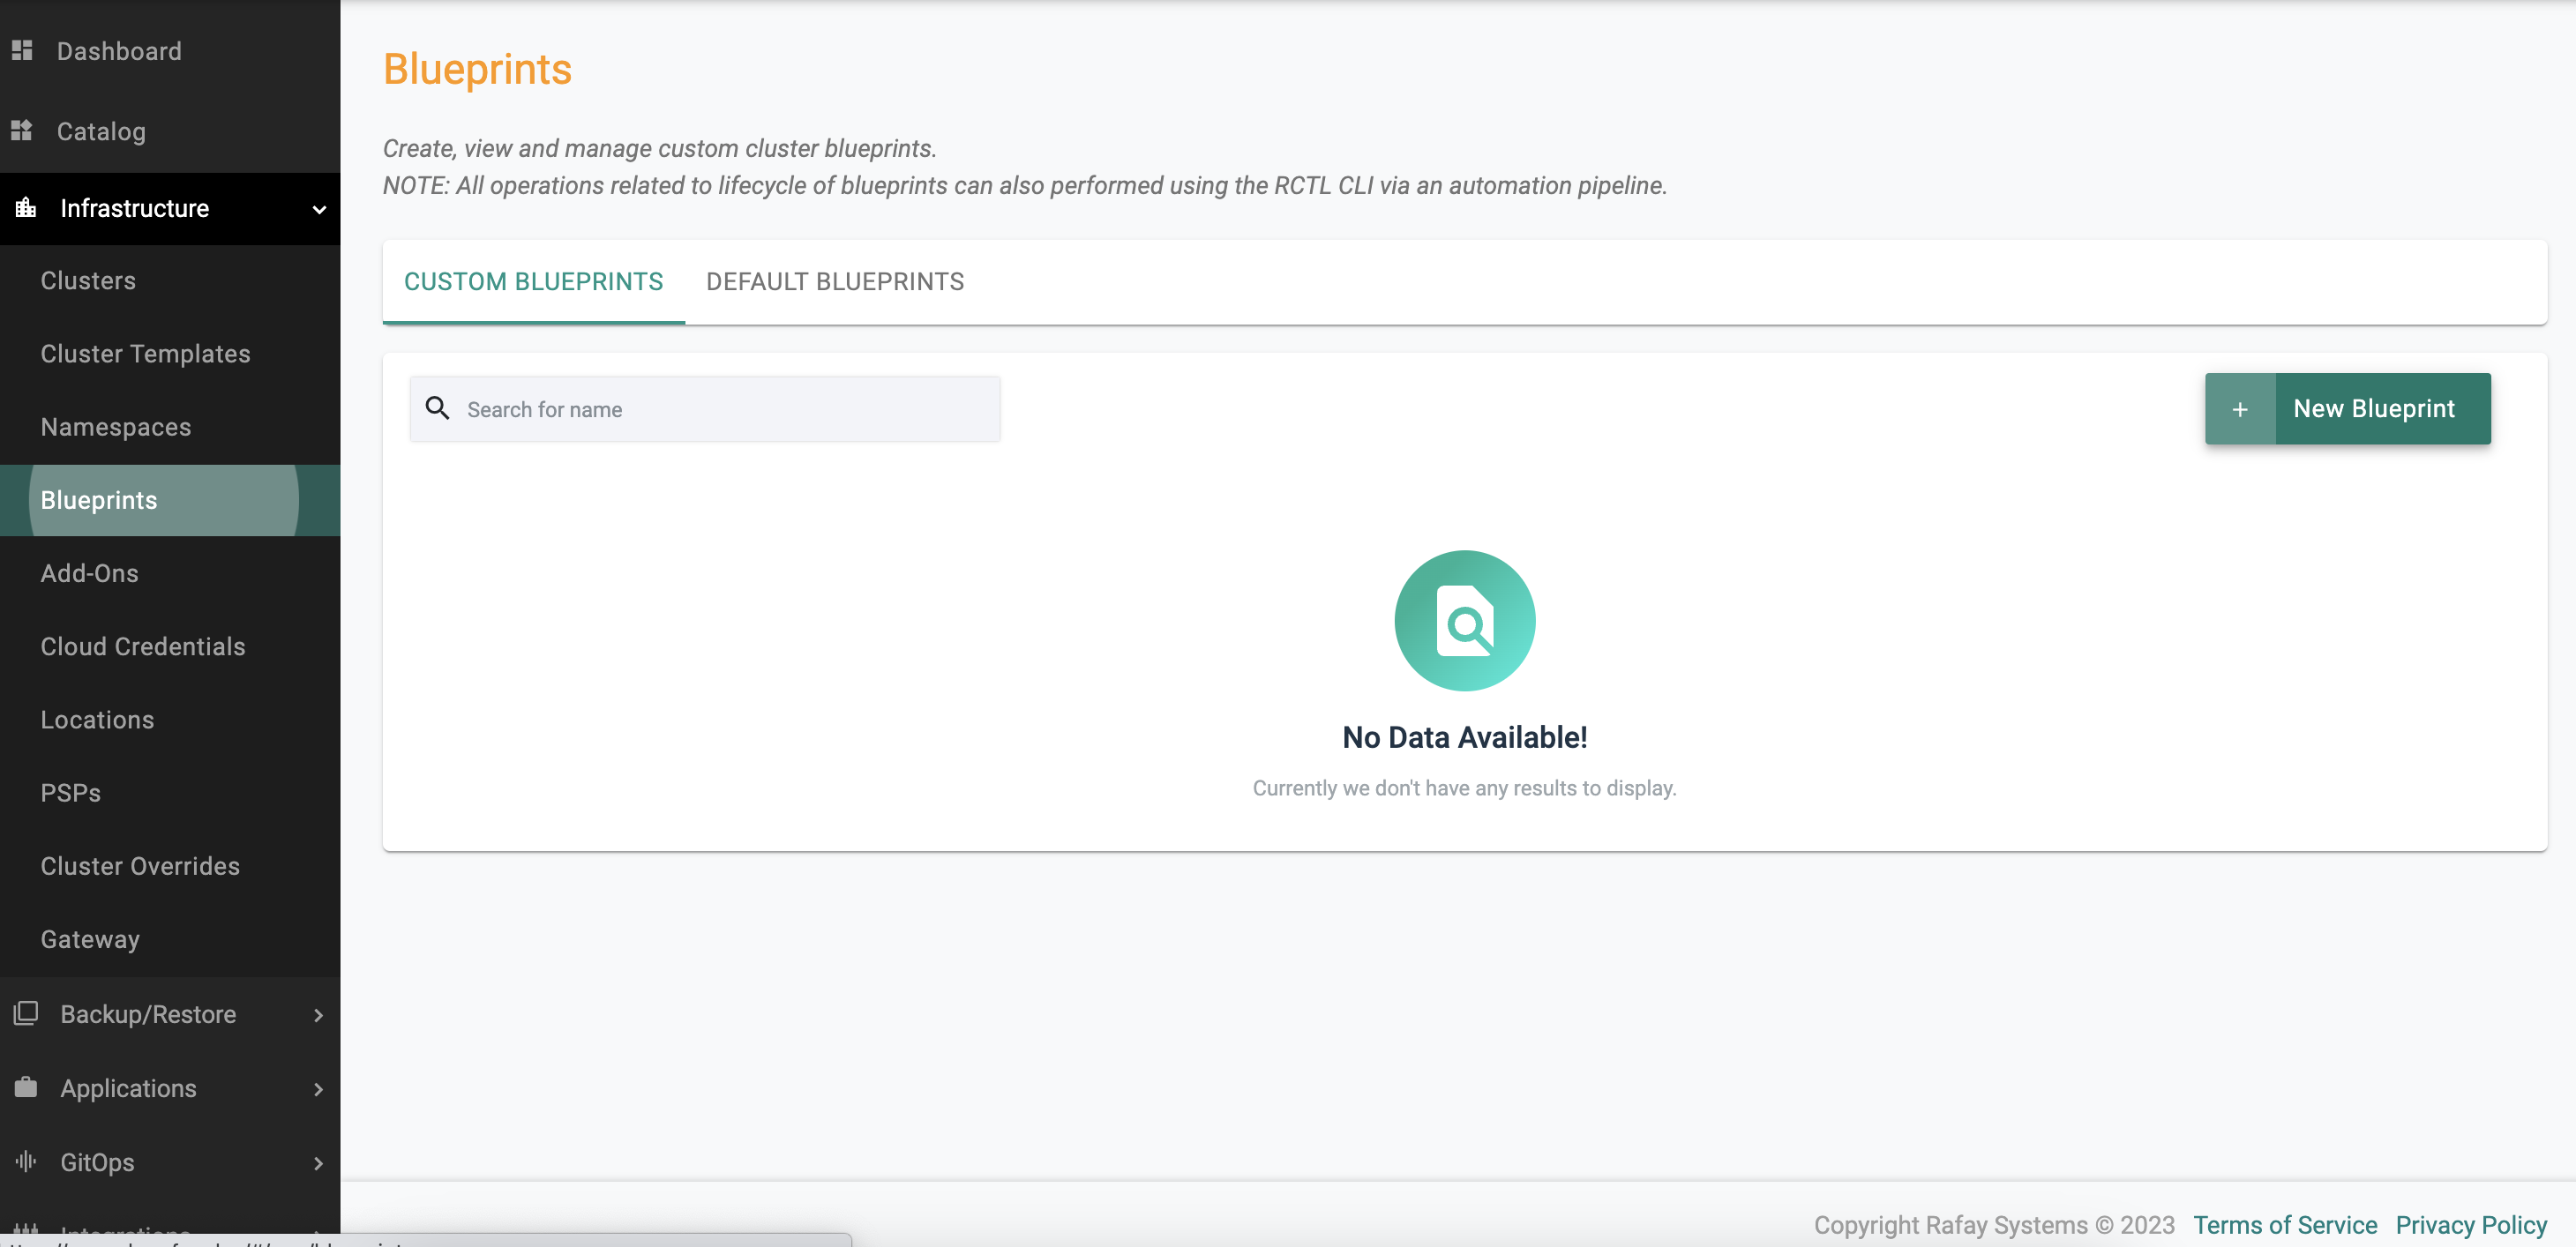
- Name appropriately -> click Save
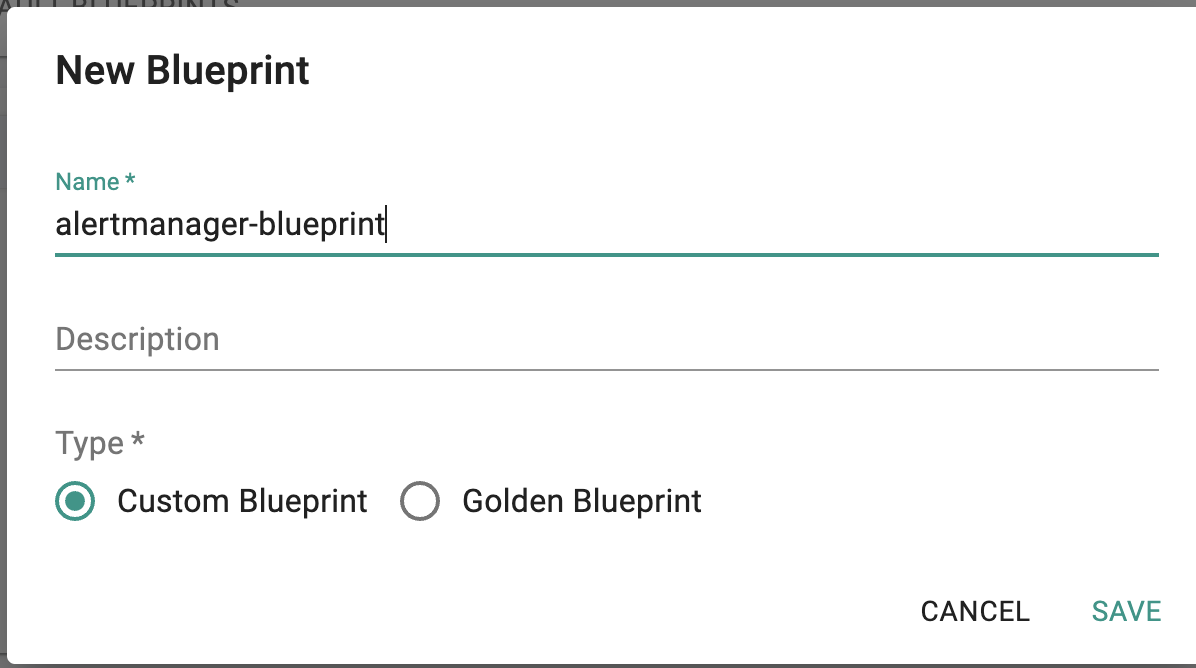
- Choose the appropriate option show in below screenshot.
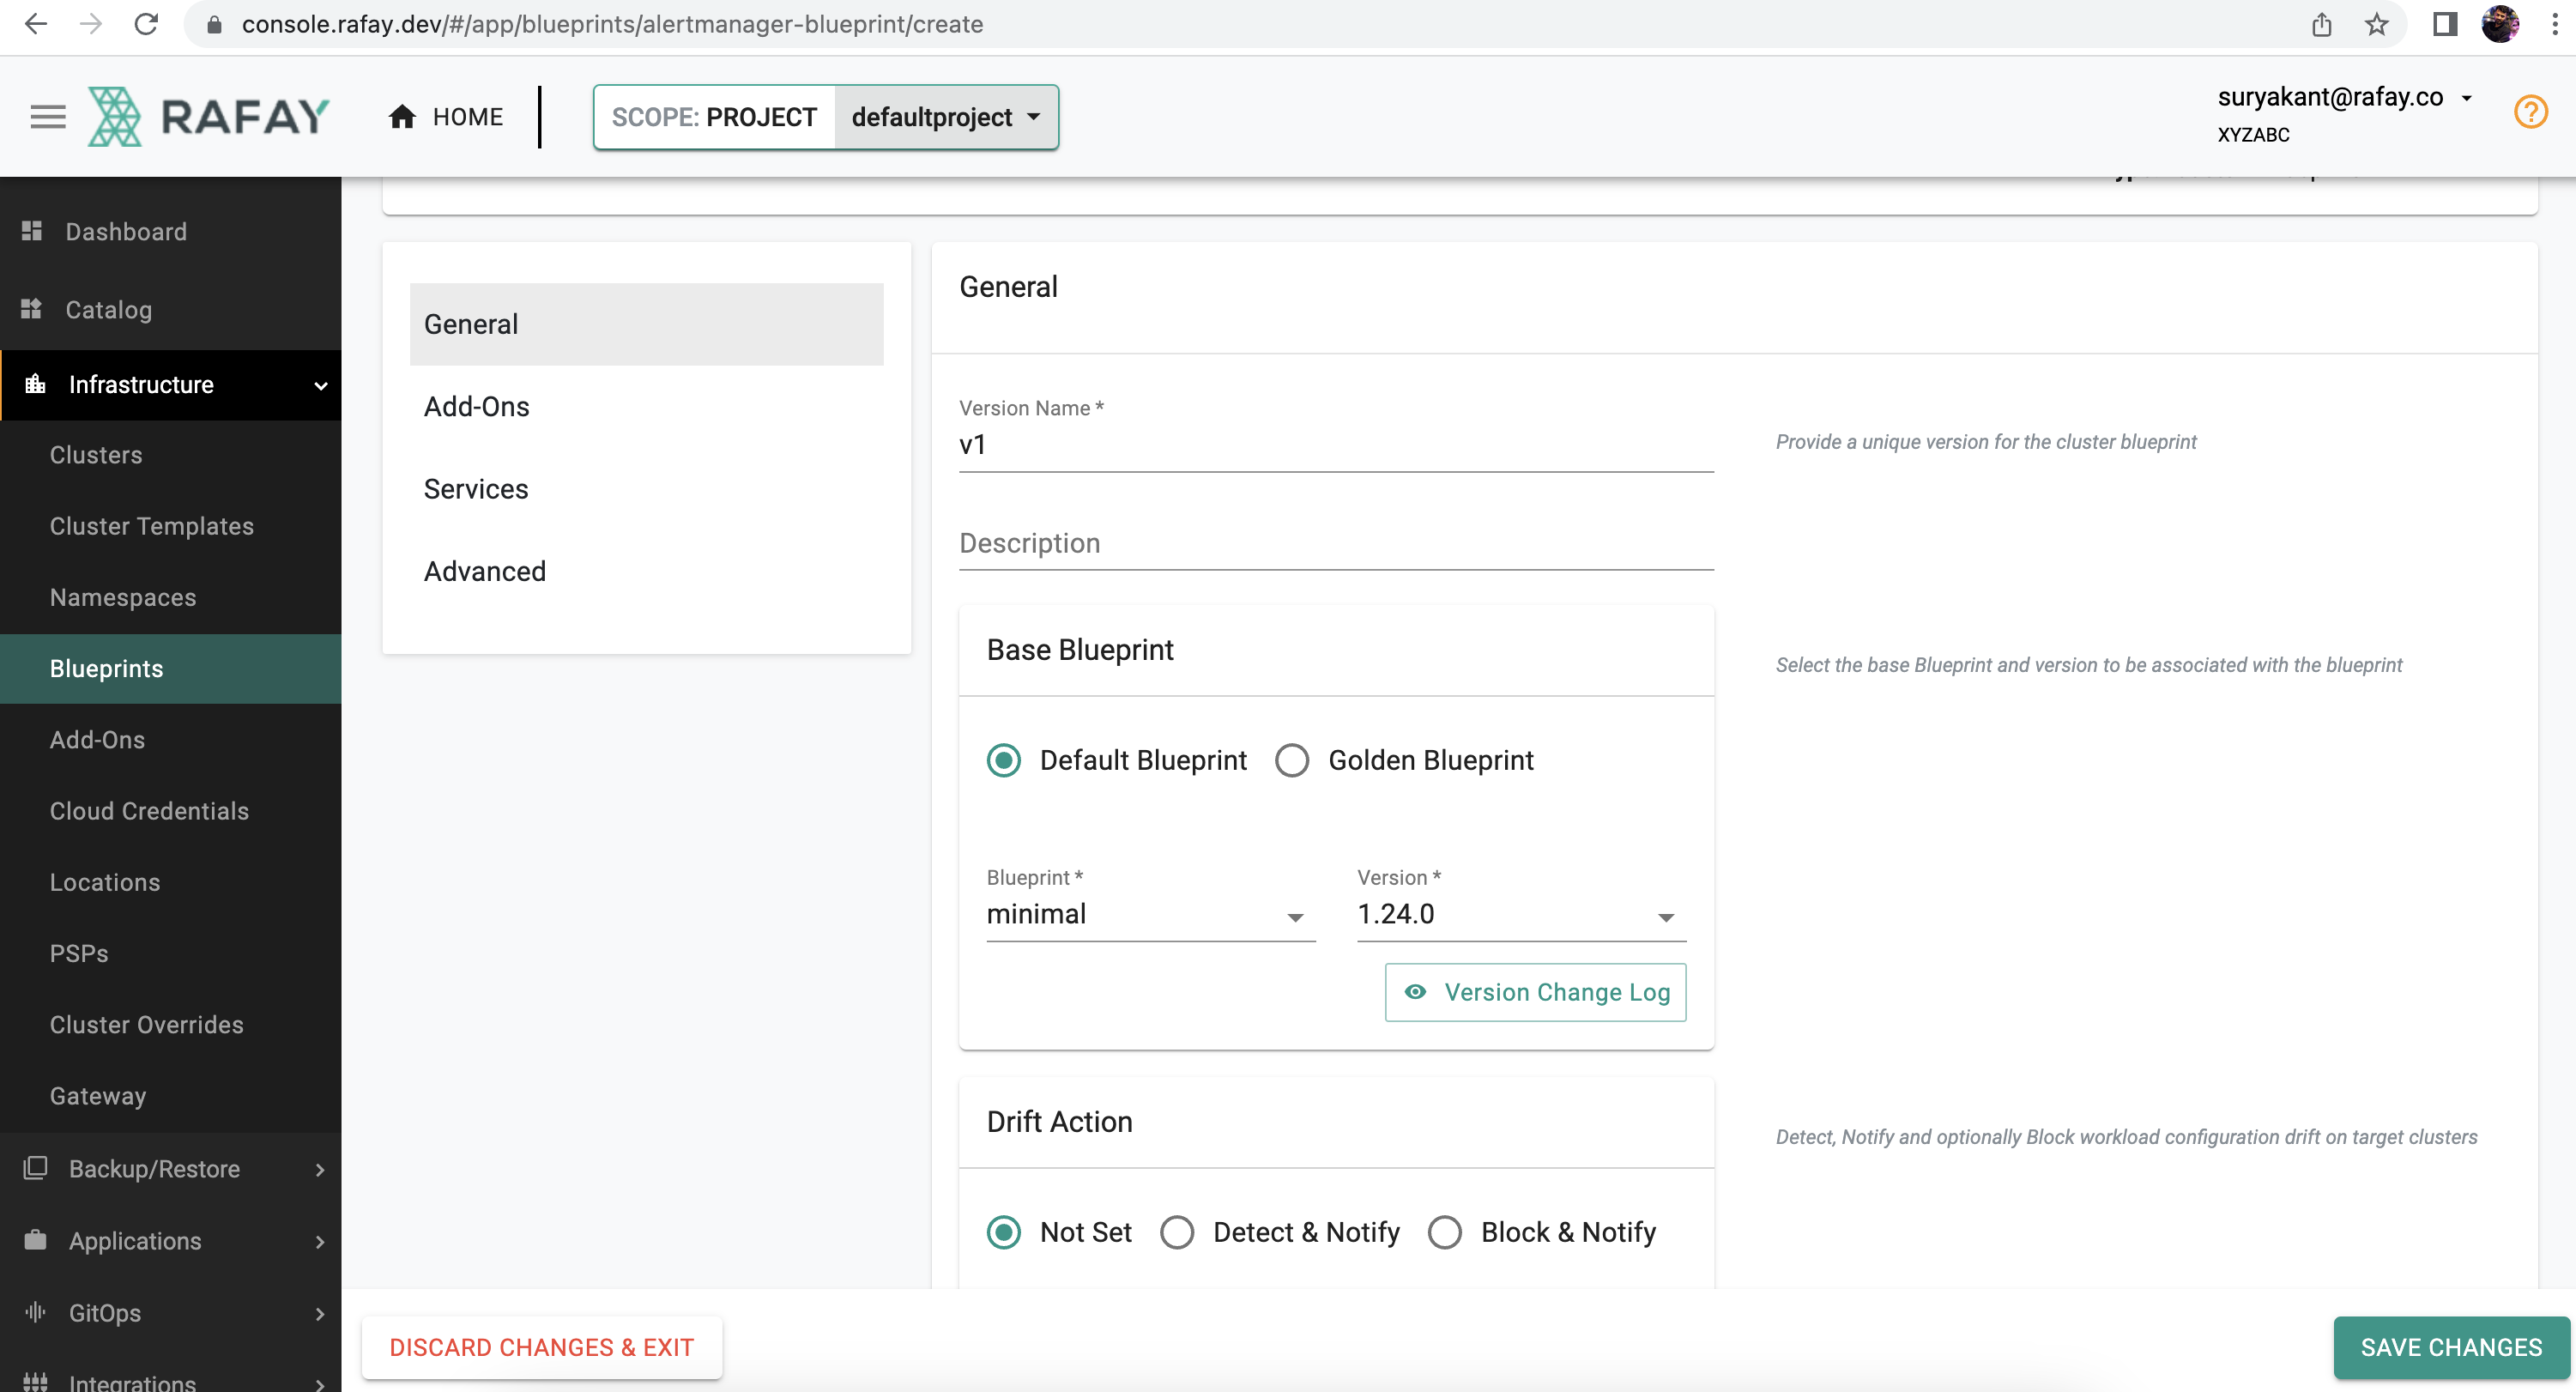
-
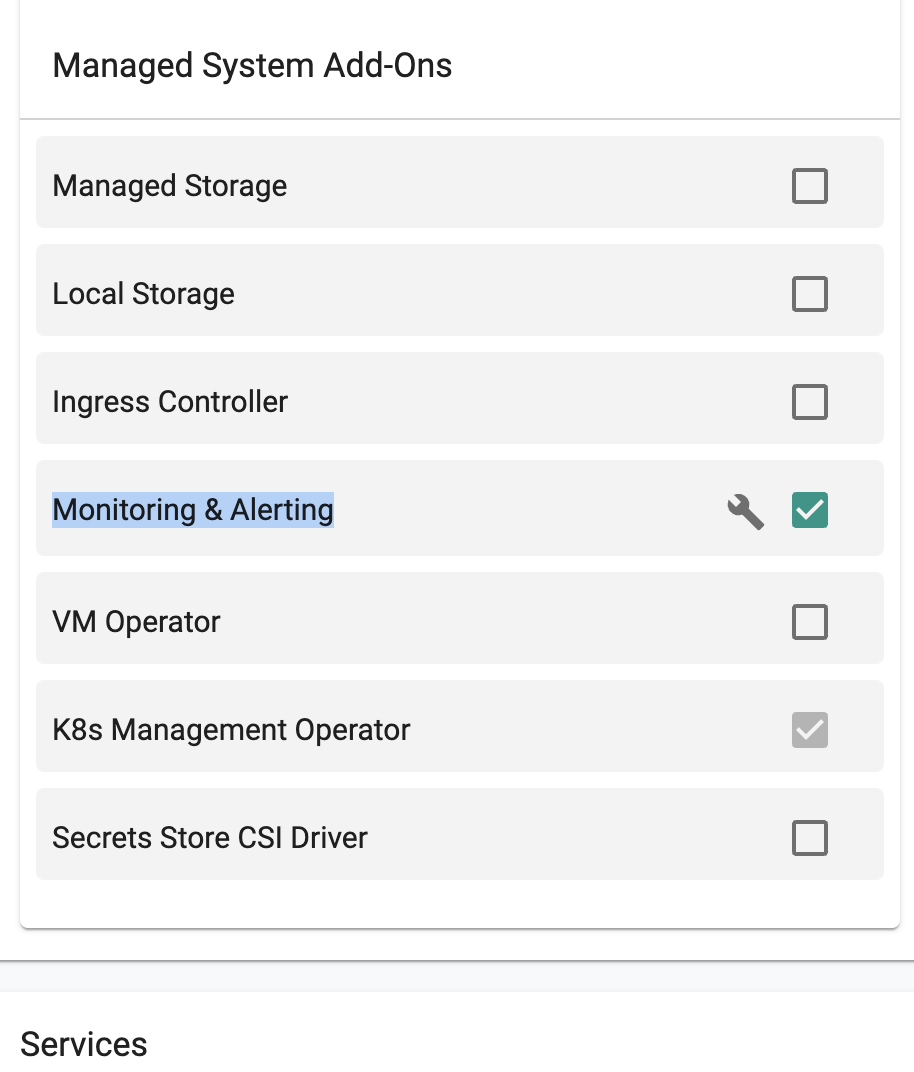
Scroll down to go to "Managed System Add-Ons" Section
-
Select the check box "Monitoring & Alerting" -> click "Save Changes"
Step 2: Apply Blueprint to the cluster
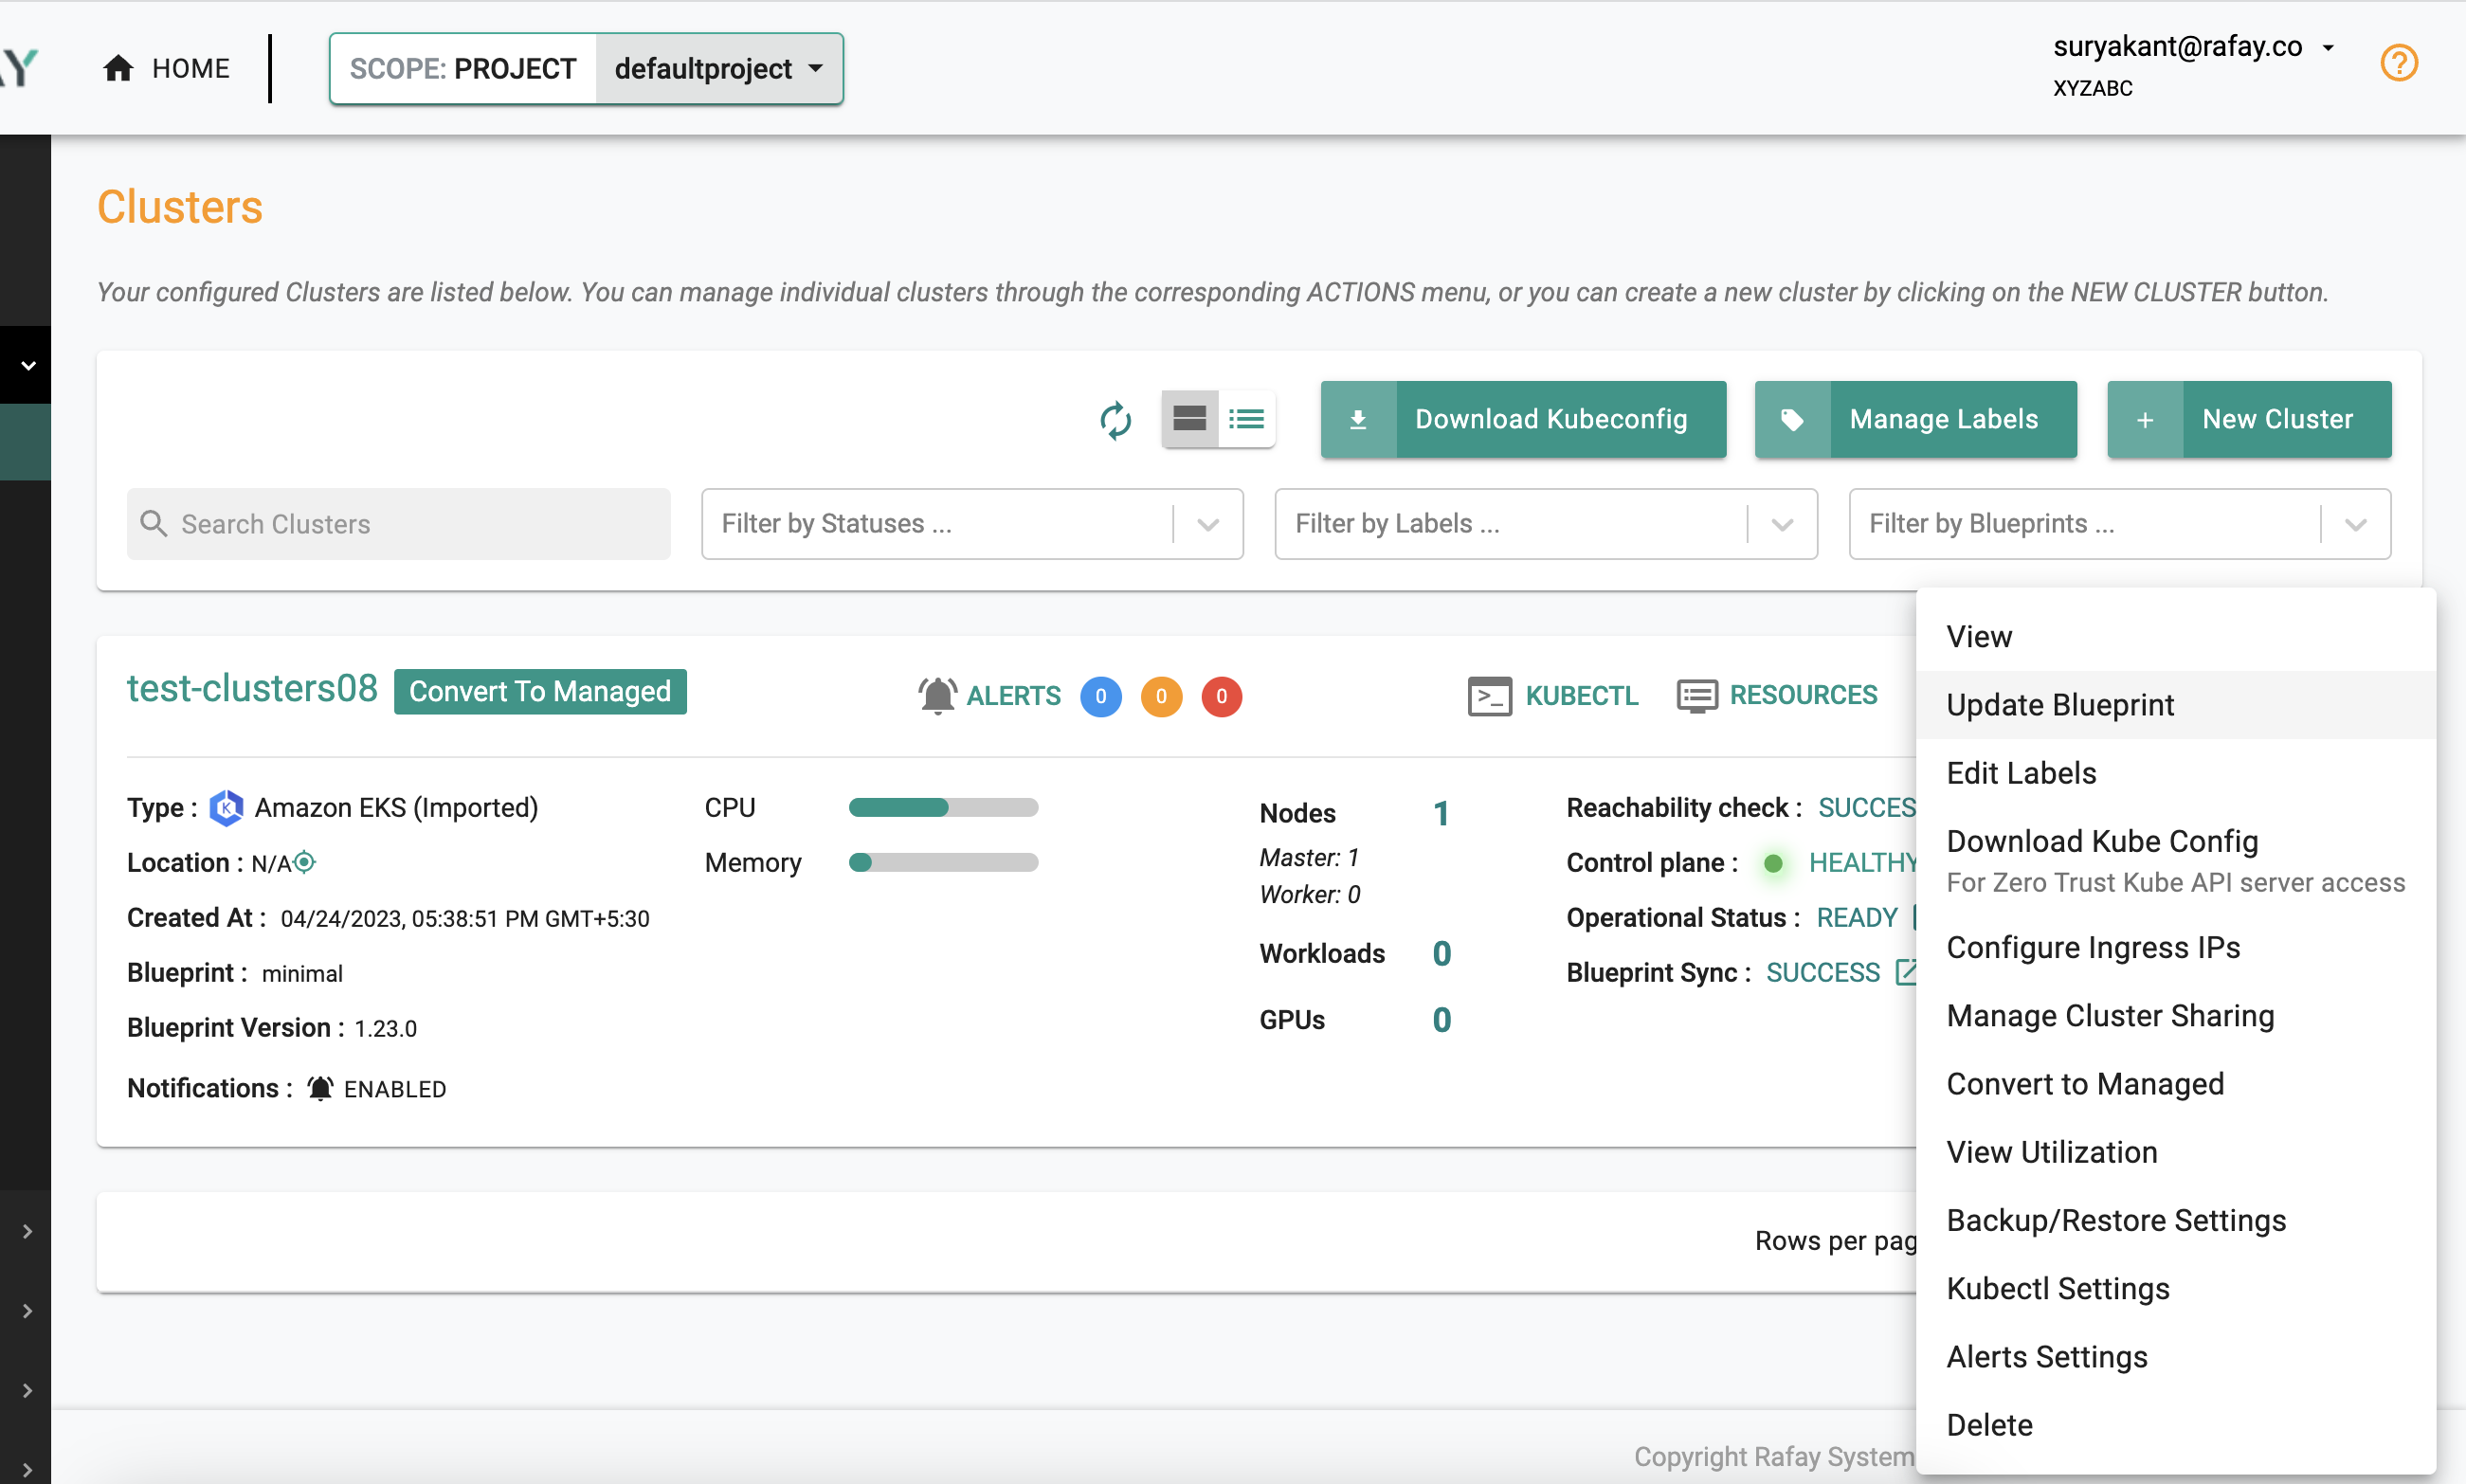
- Go back to Infrastructure -> Cluster and click the gear icon on the right side of the page -> Click "Update Blueprint"
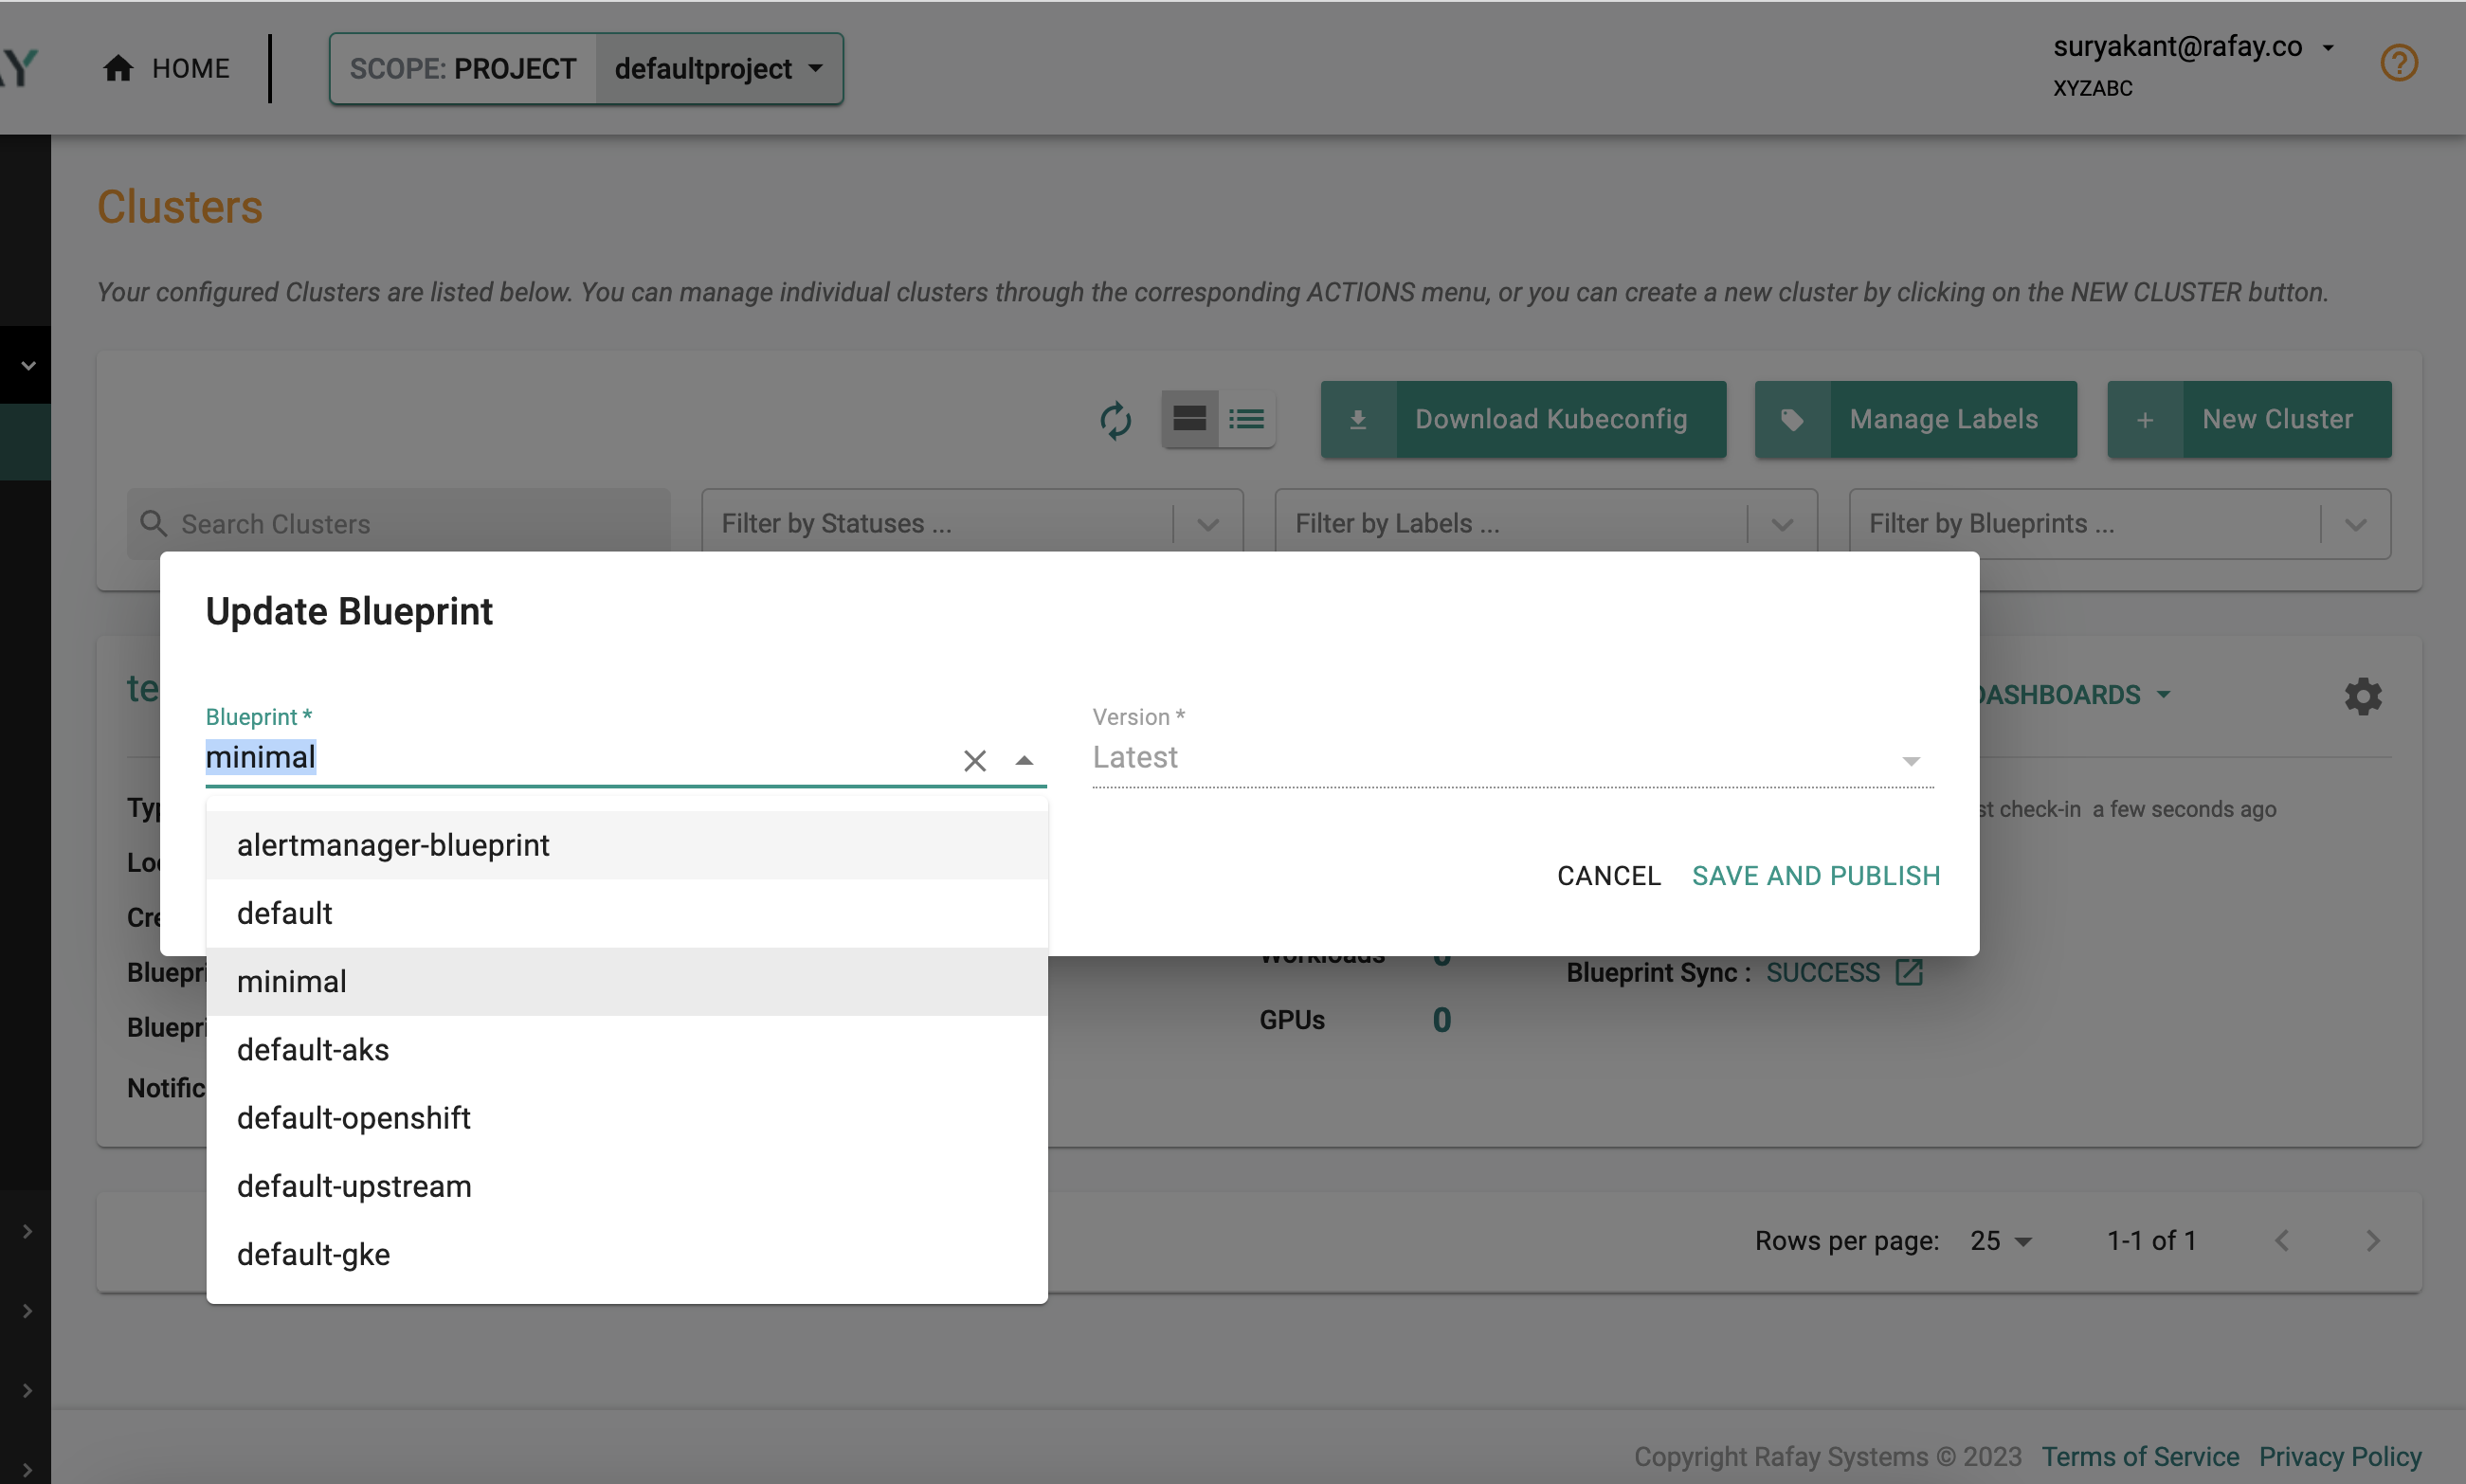
- Select the newly created blueprint "alertmanager-blueprint" and version -> click "Save and Publish"
- Wait for the alertmanager-blueprint to sync
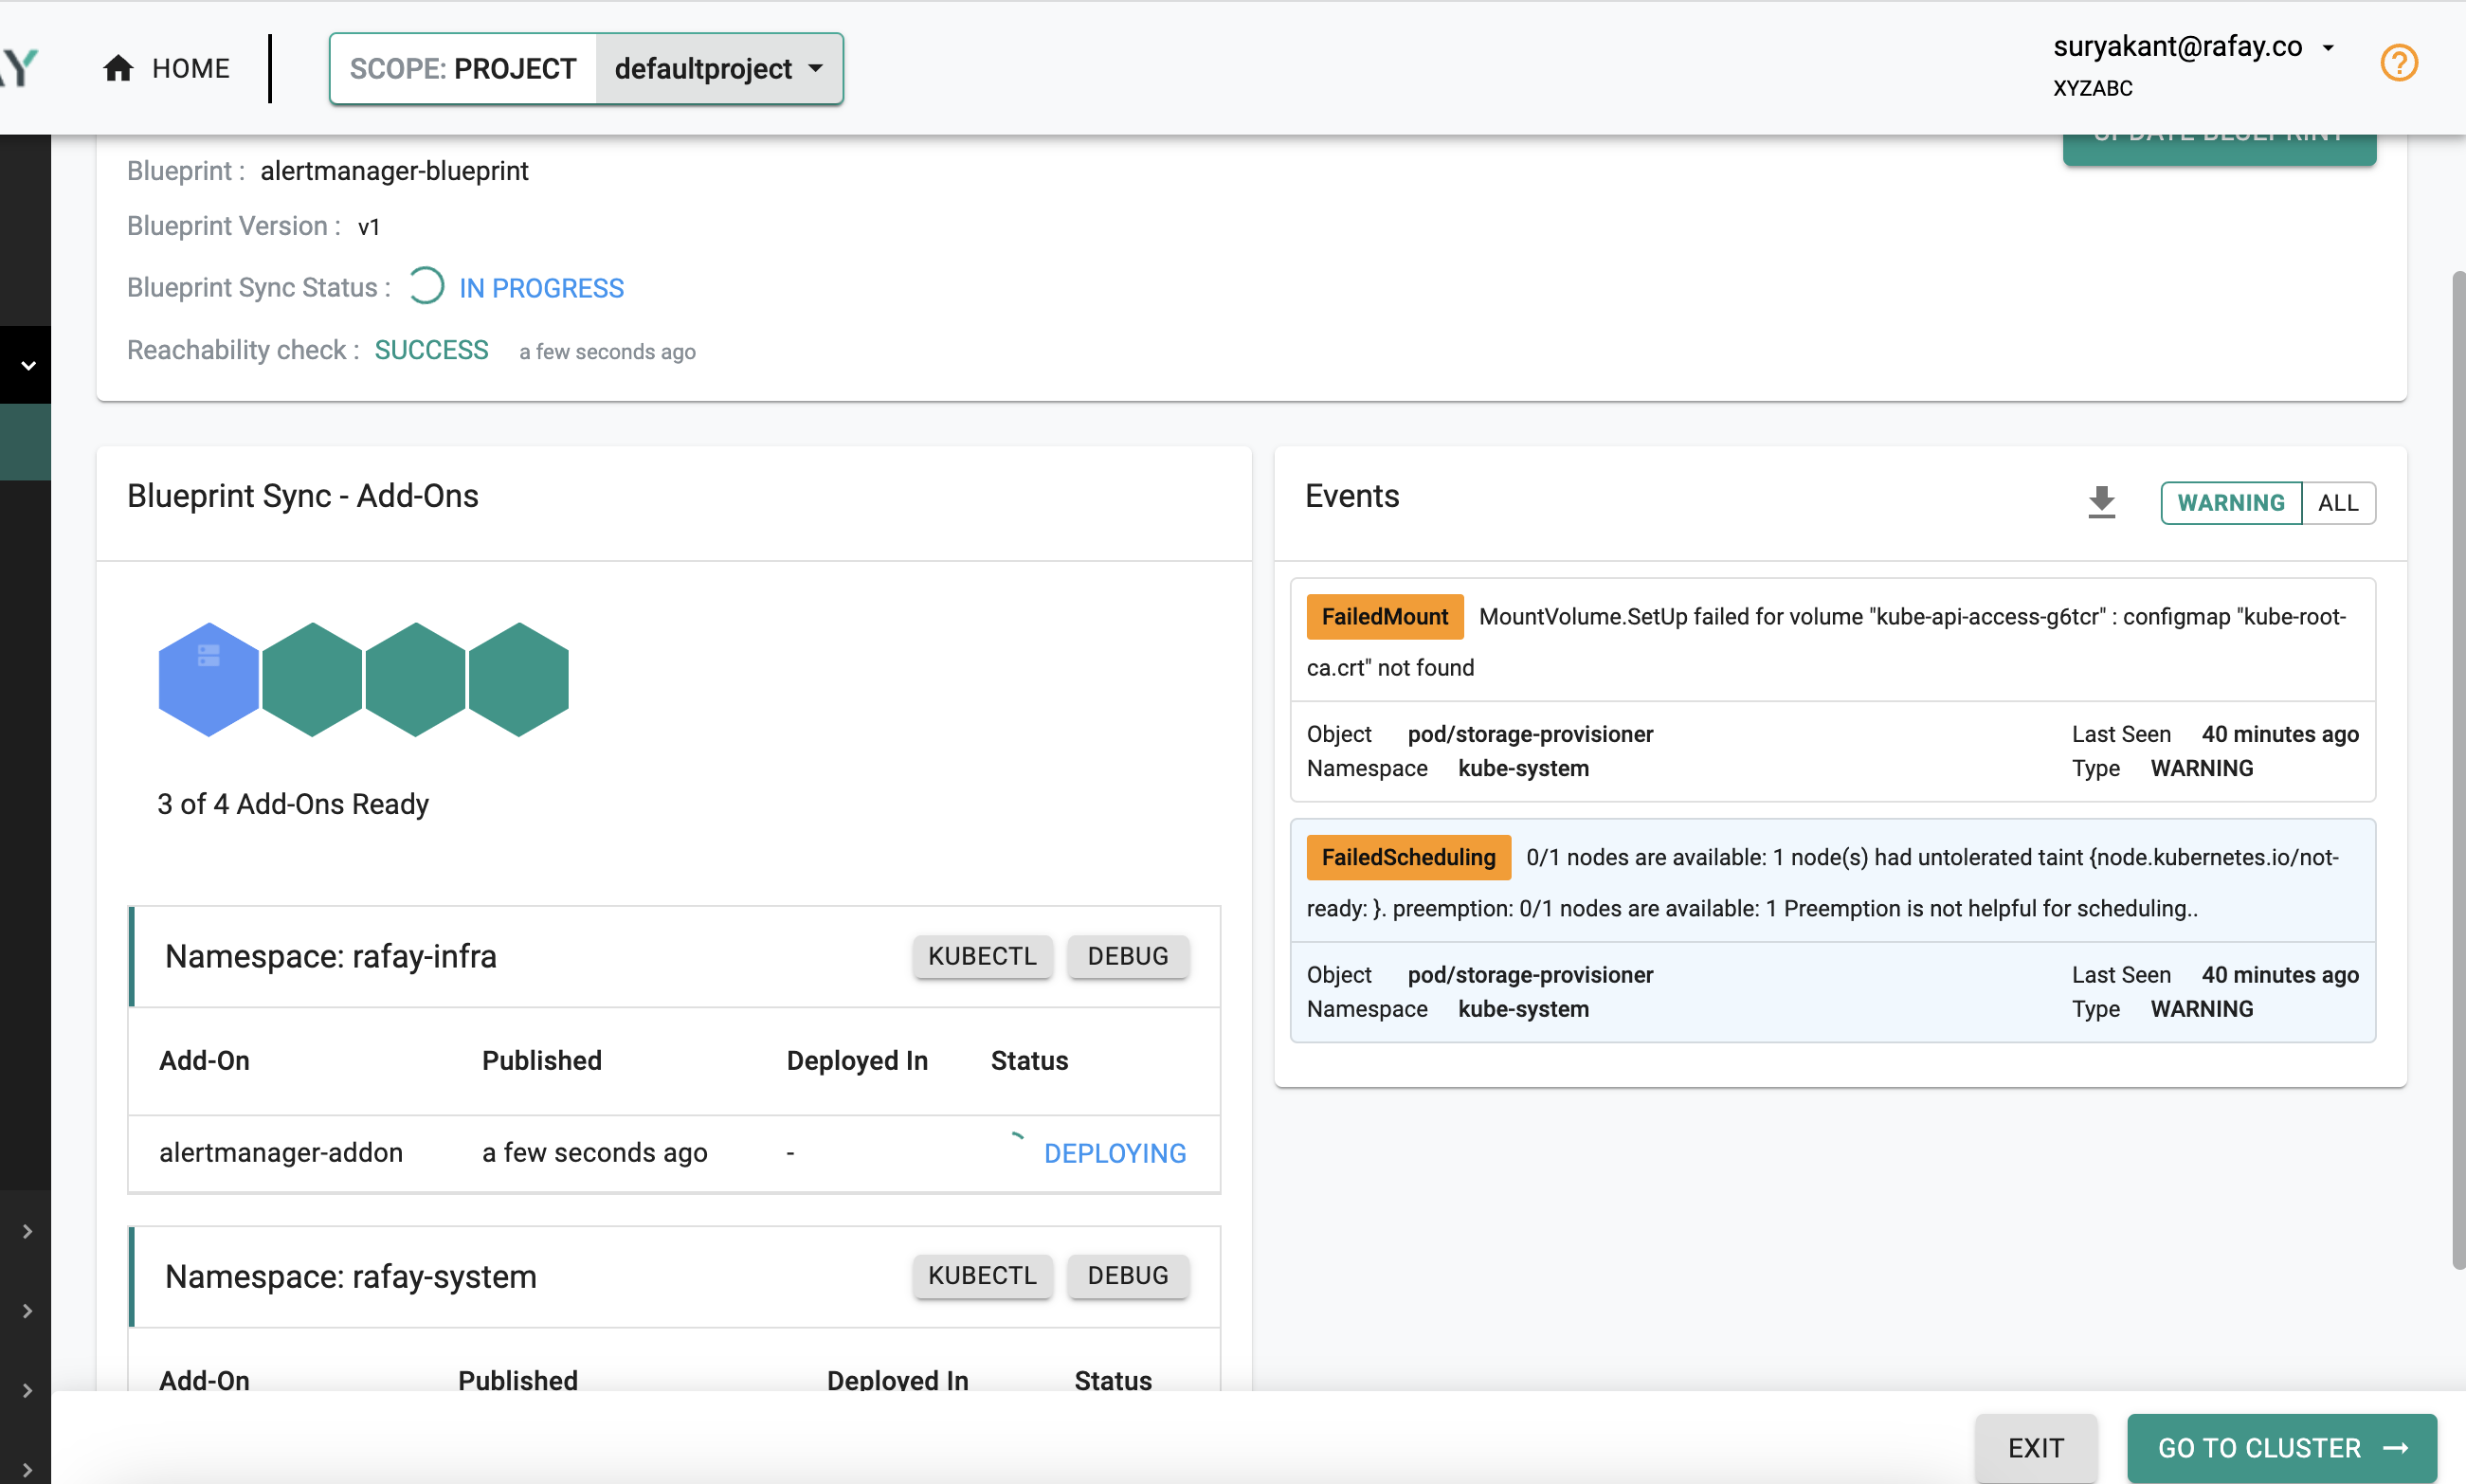
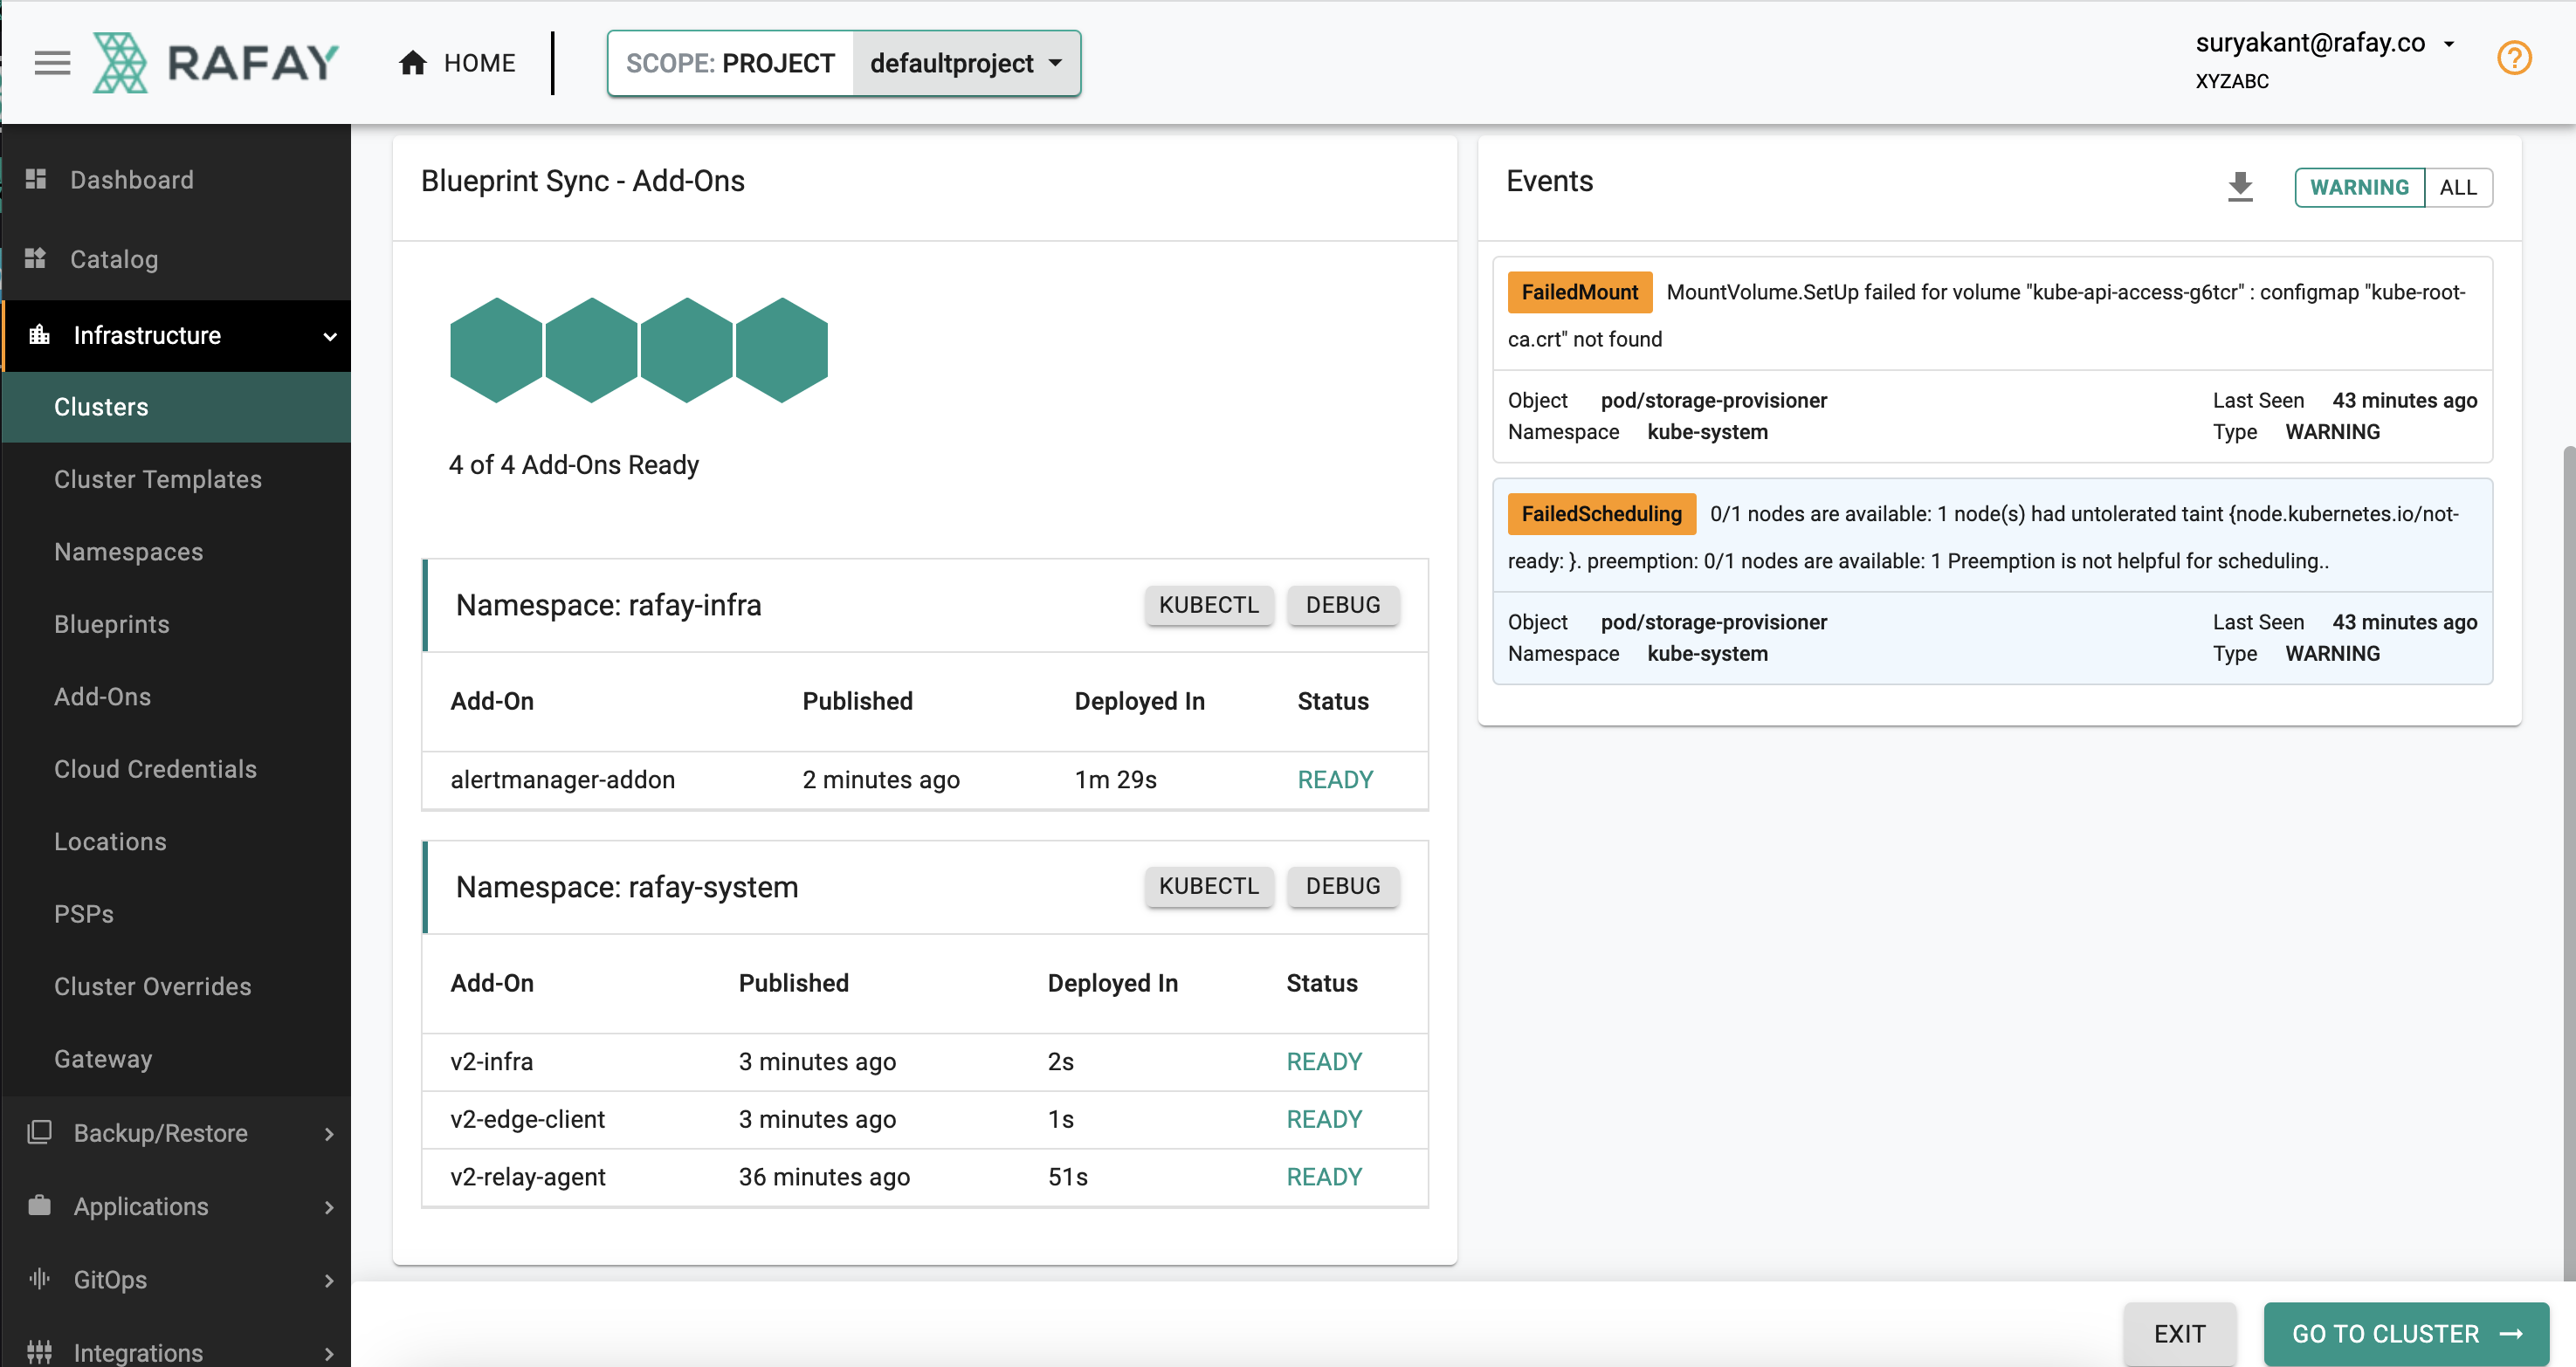
- Observe no Alerts
Step 3: Simulate a Failure Condition
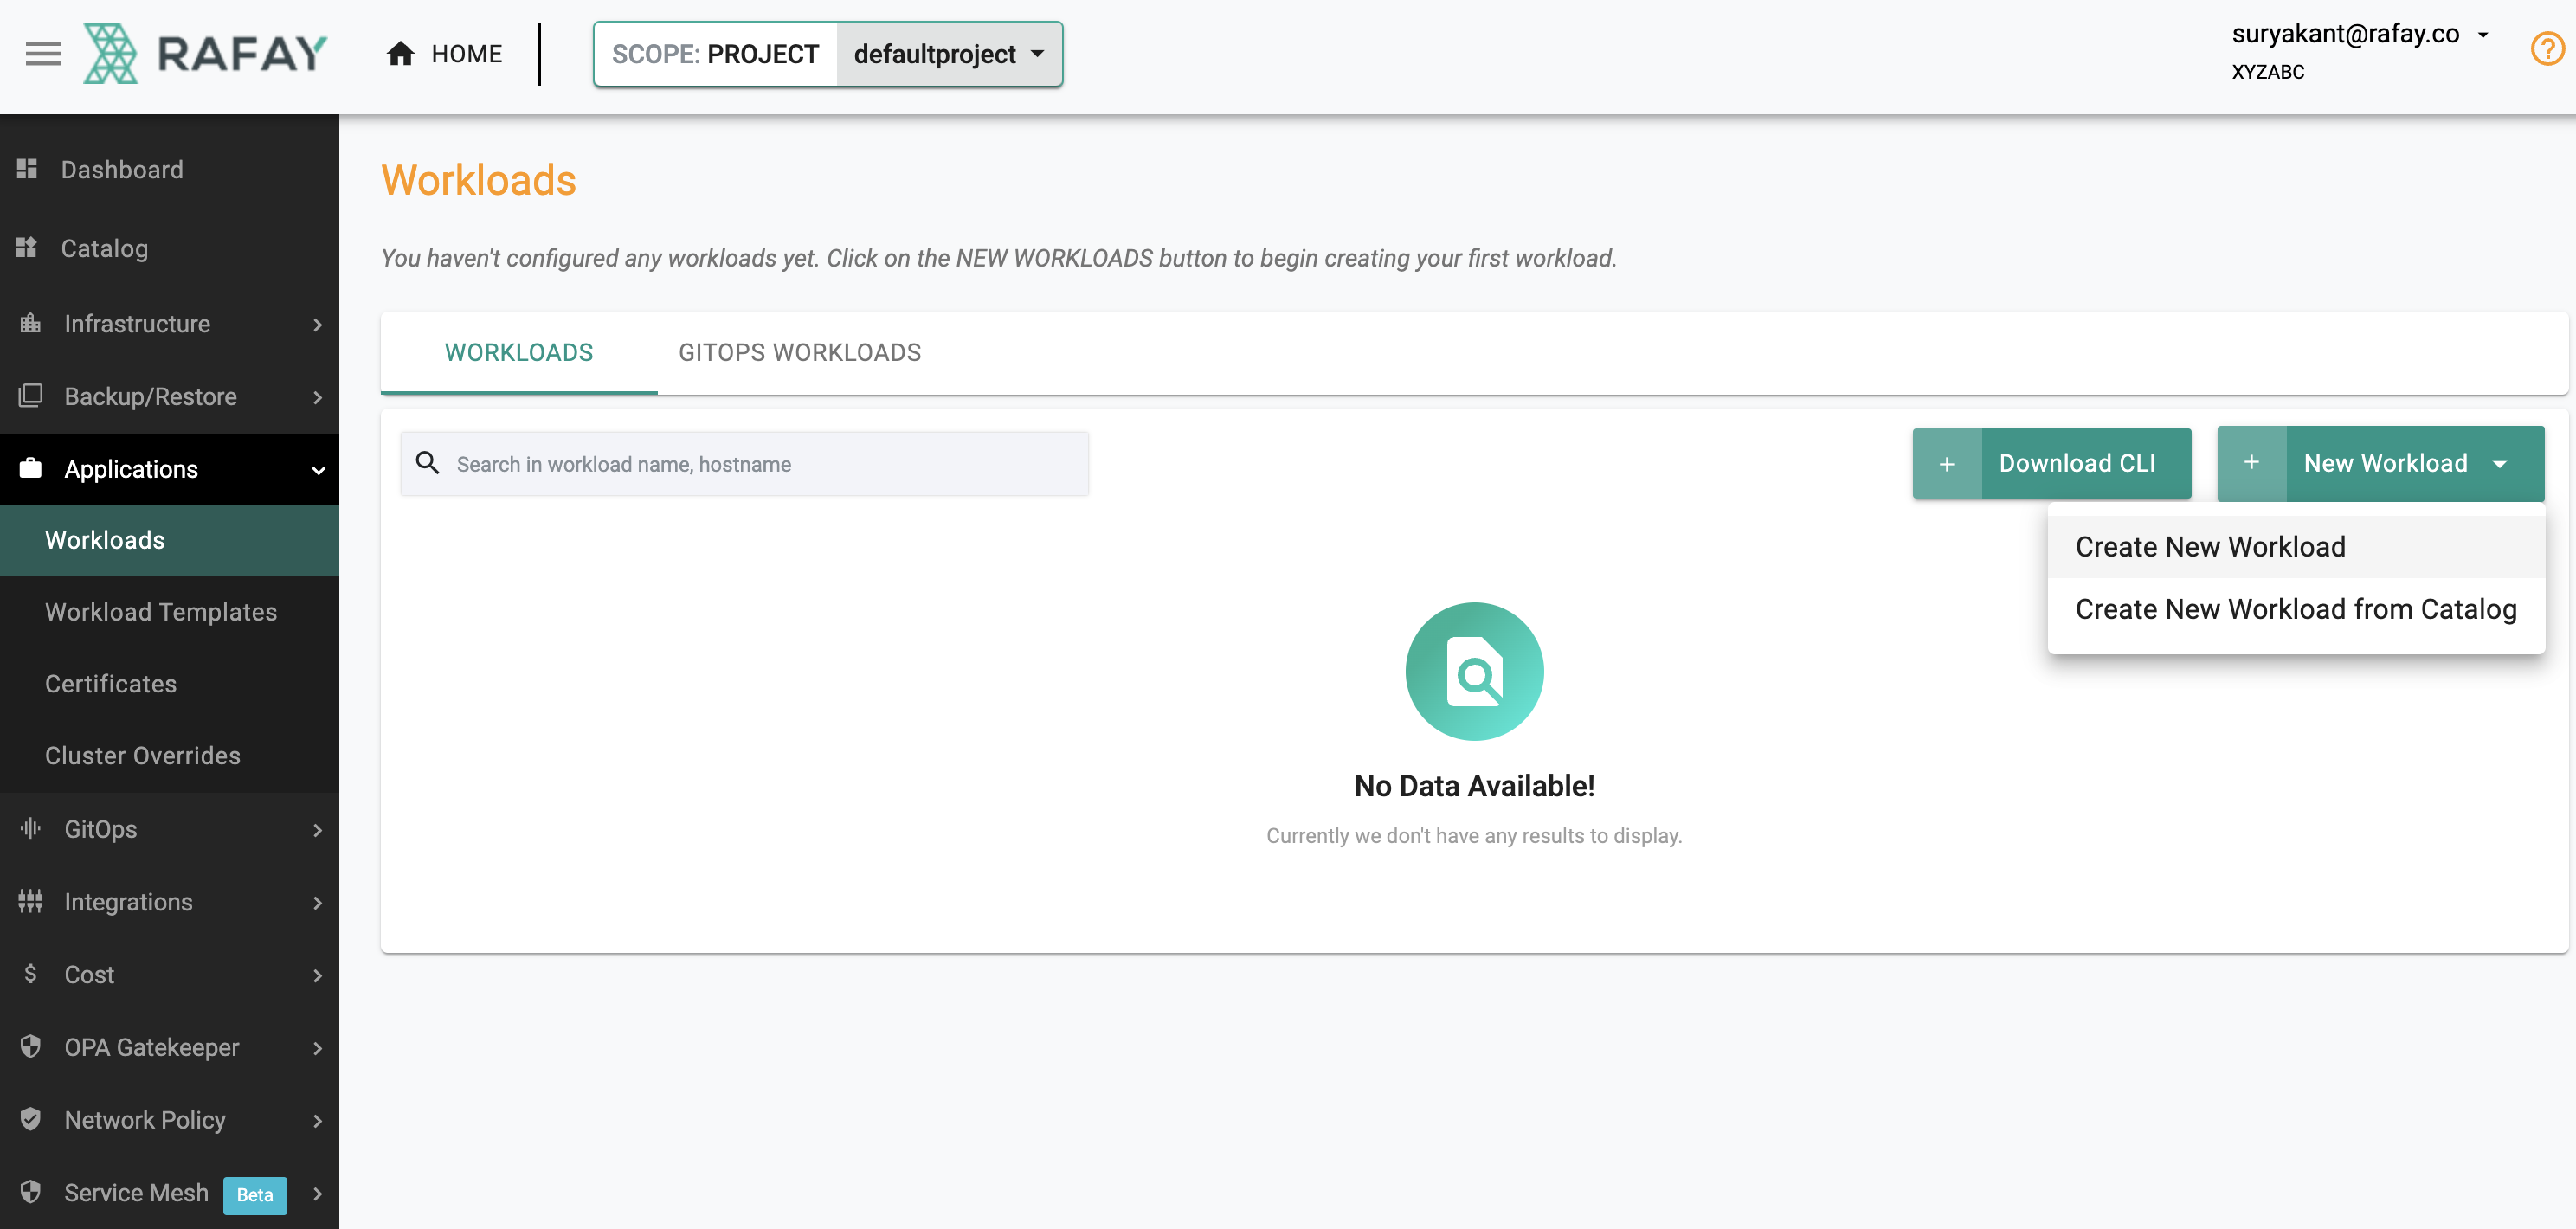
- Go to Application -> Workloads -> Click on " New Workload" -> Select "Create New Workload"
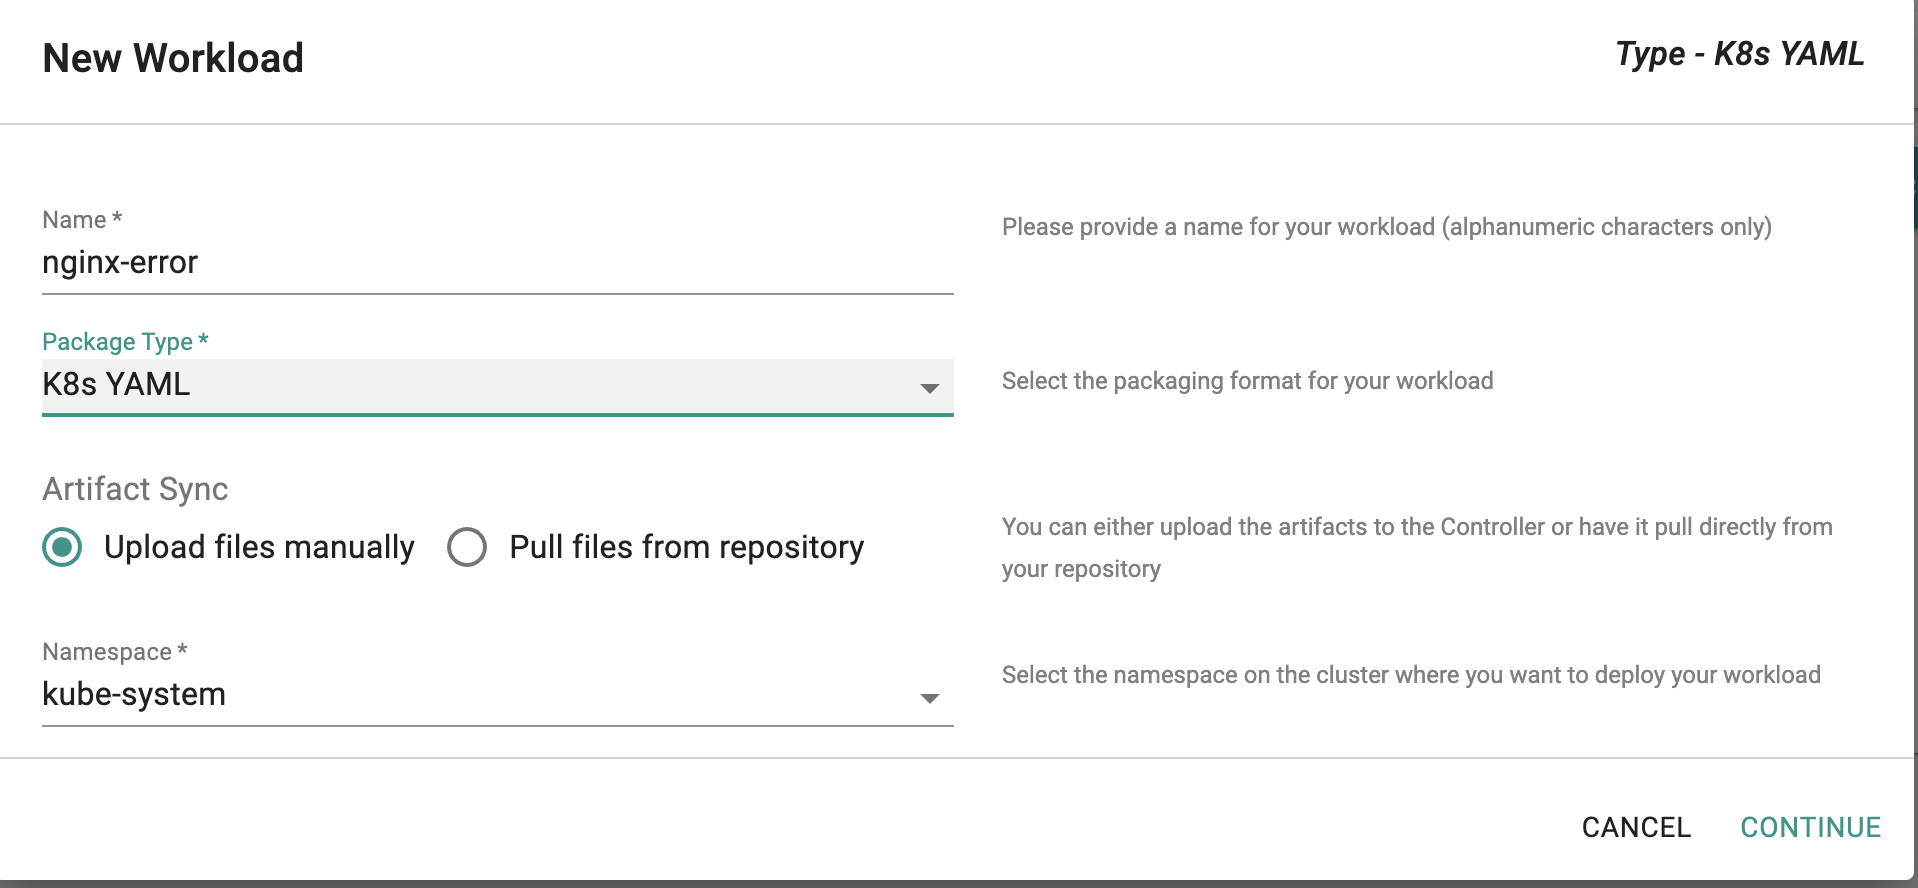
- Choose appropriate name and select options as shown in screenshot below -> Click " Continue" to go to the Upload Tab
-
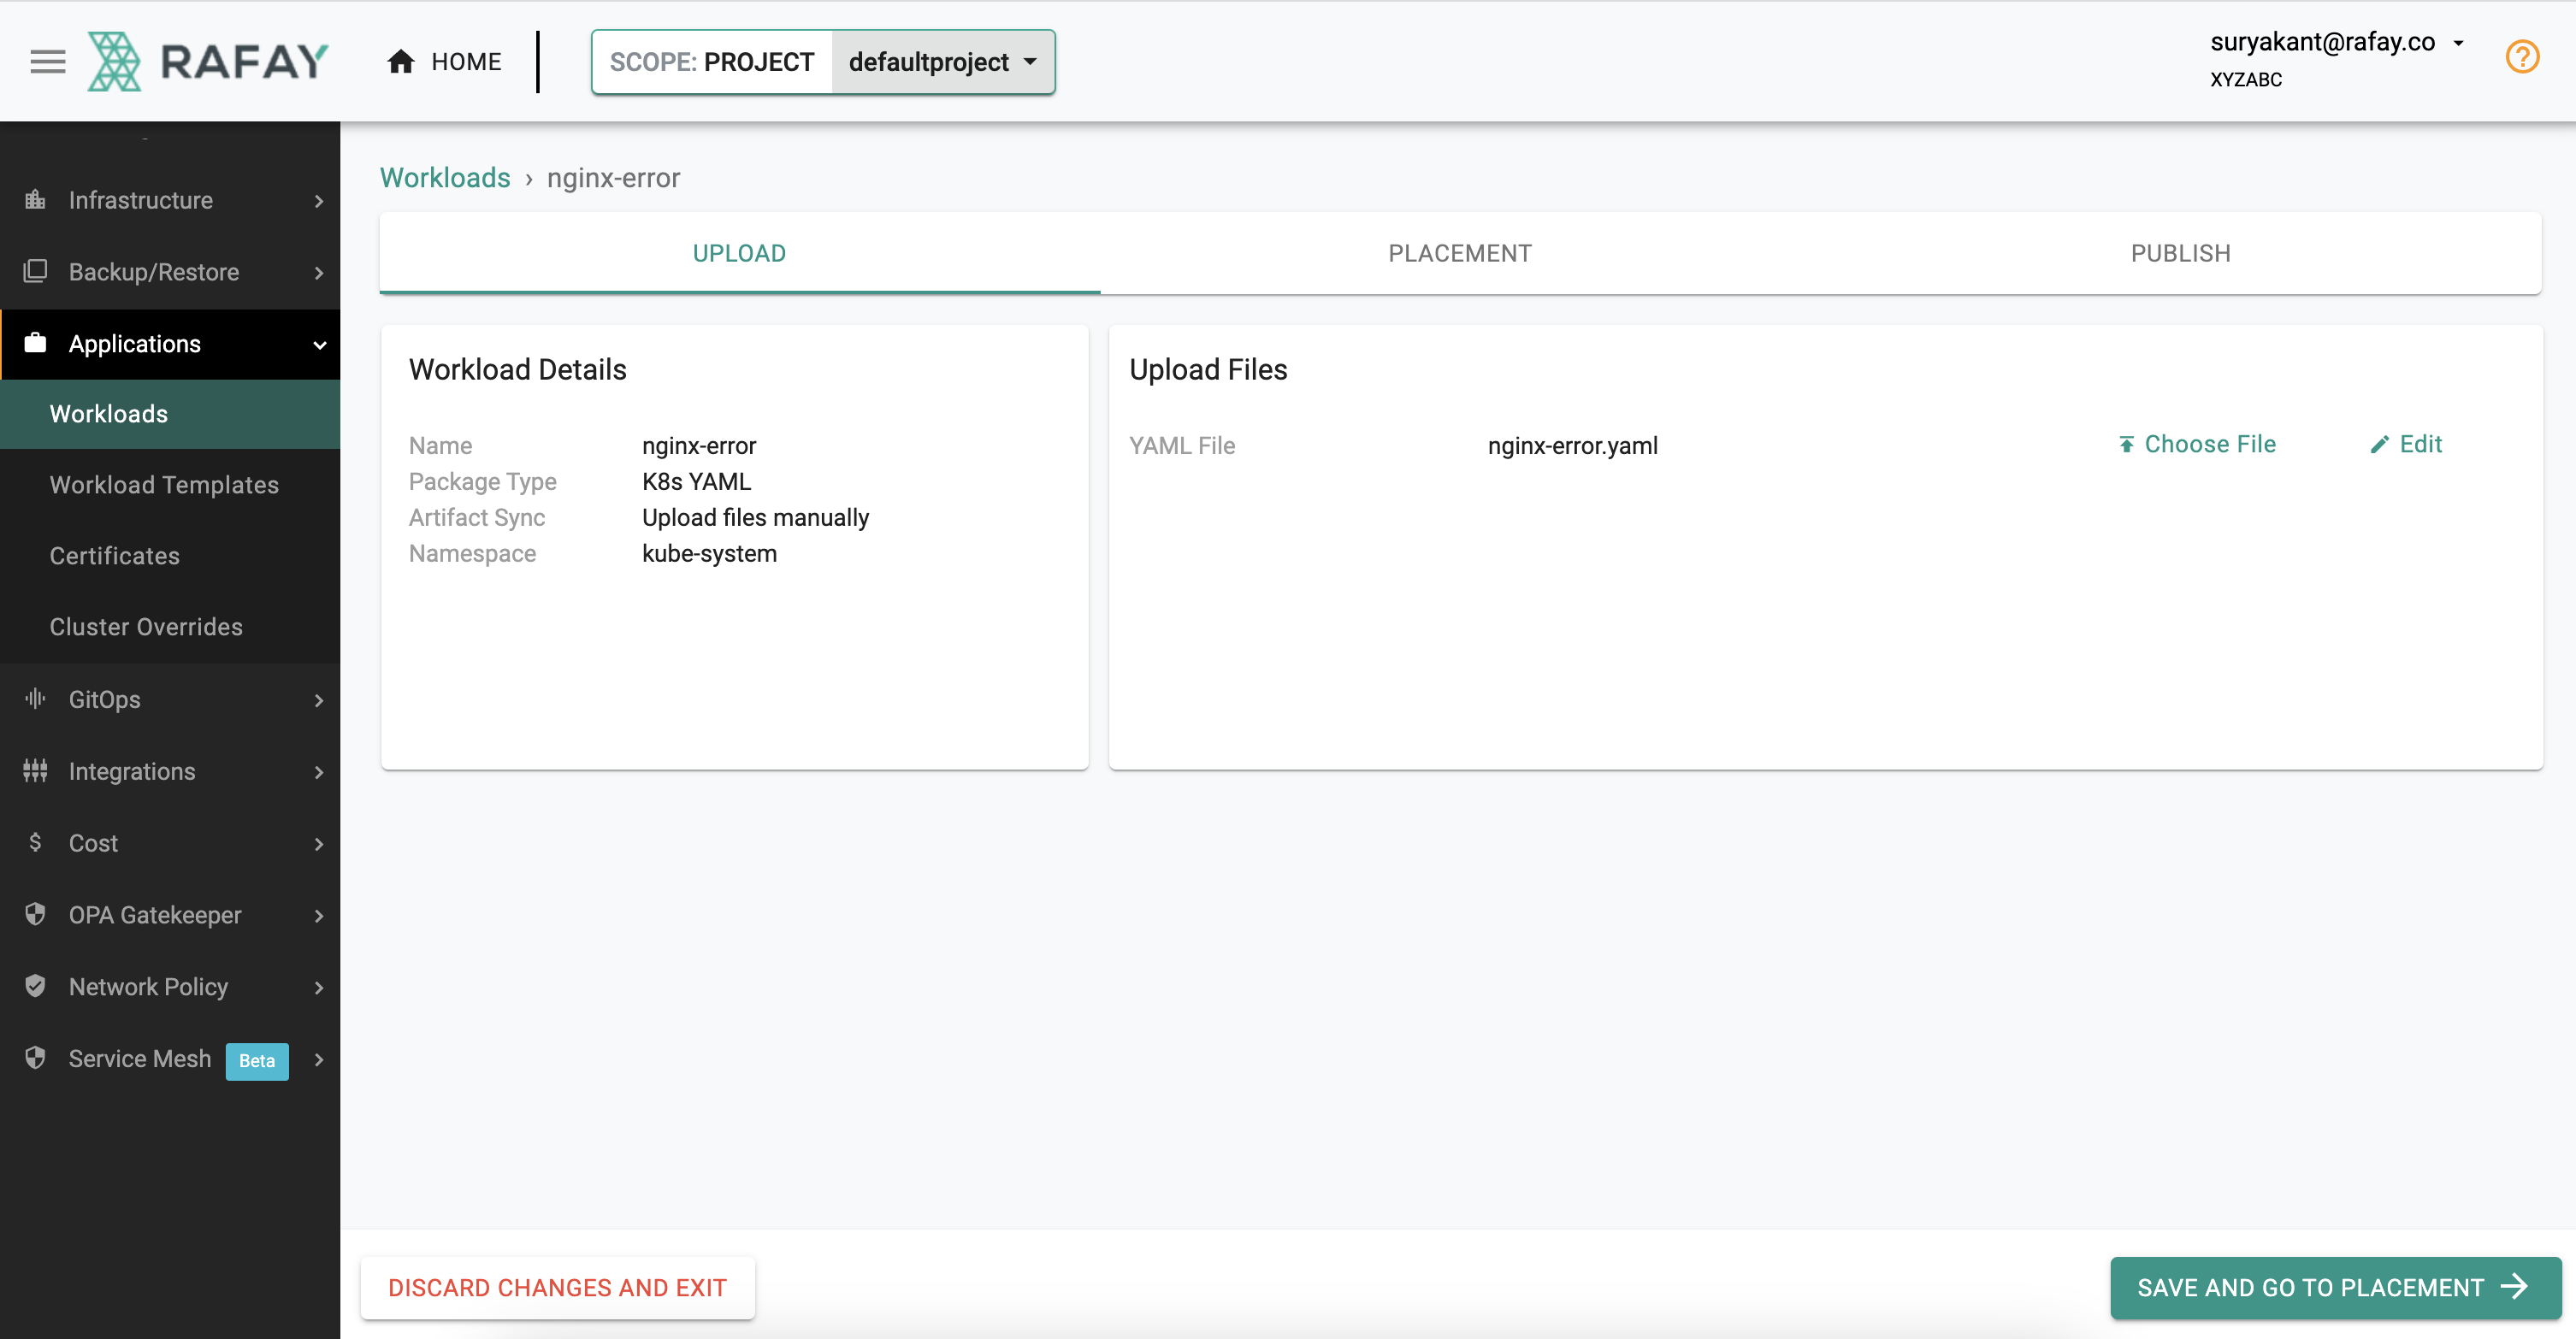
On the Upload Tab -> click " Choose File"
-
Upload the yaml below yaml file and click -> " Save And Go To Placement"
  apiVersion: apps/v1
  kind: Deployment
  metadata:
    name: nginx-deployment
  spec:
    selector:
      matchLabels:
        app: nginx
    replicas: 2 # tells deployment to run 2 pods matching the template
    template:
      metadata:
        labels:
          app: nginx
      spec:
        containers:
        - name: nginx
          image: nginx-error:1.14.2
          ports:
          - containerPort: 80
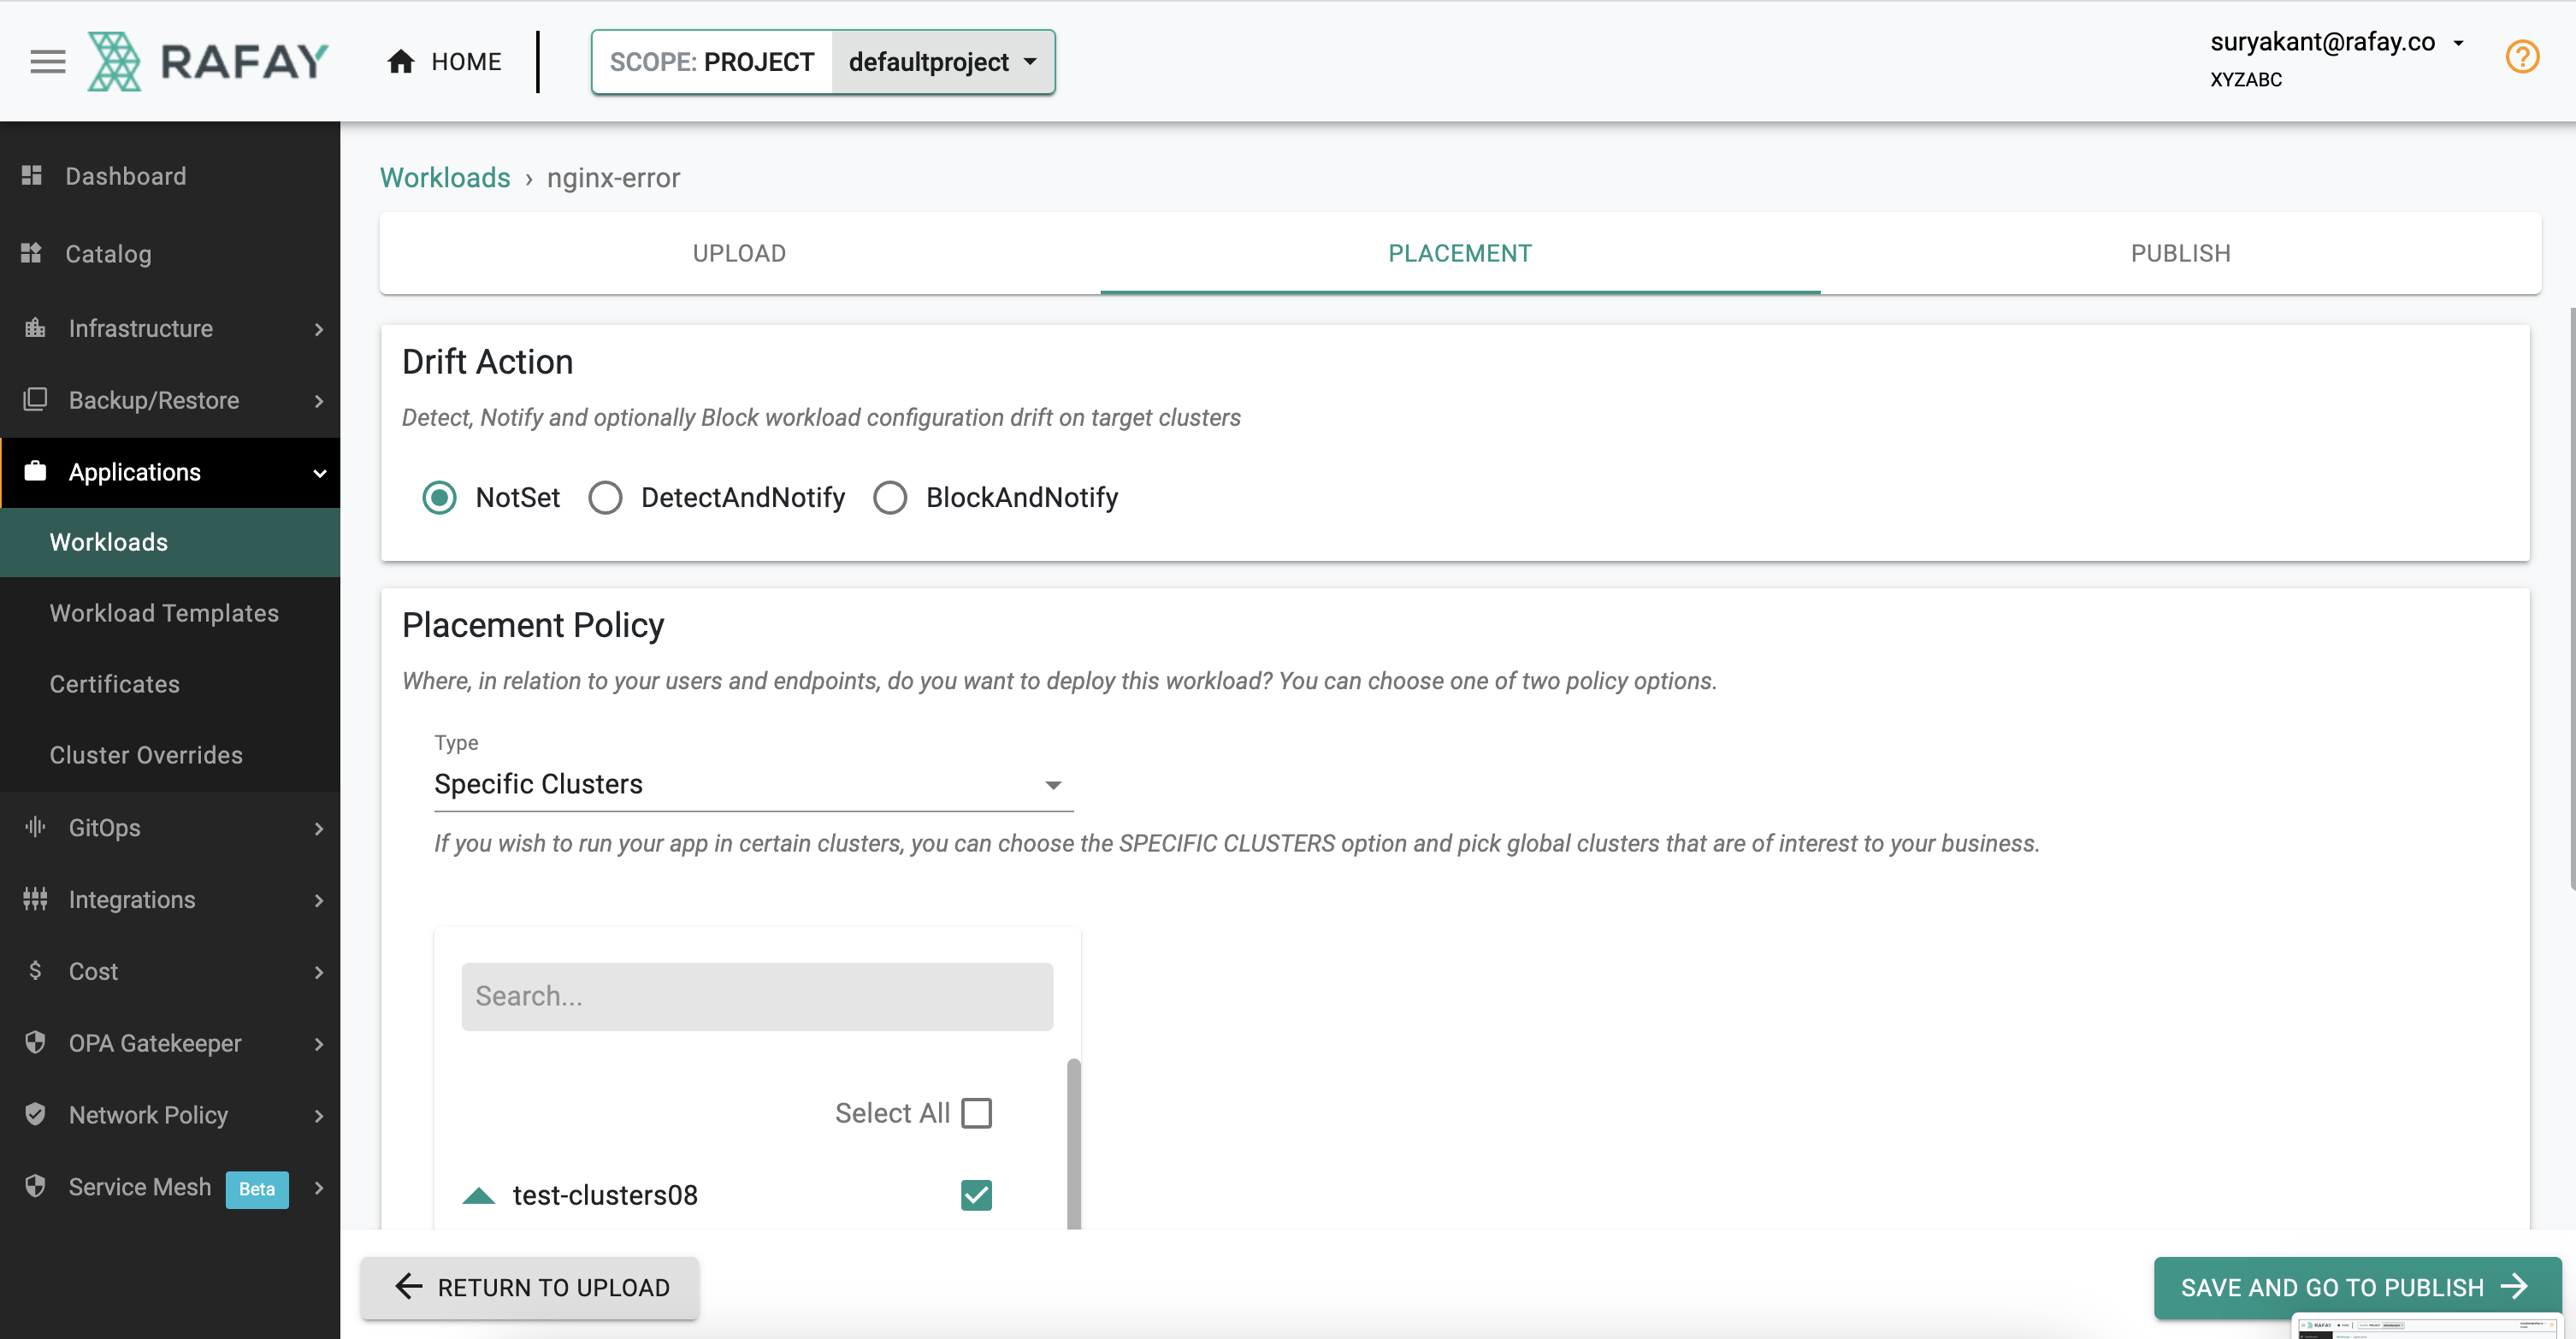
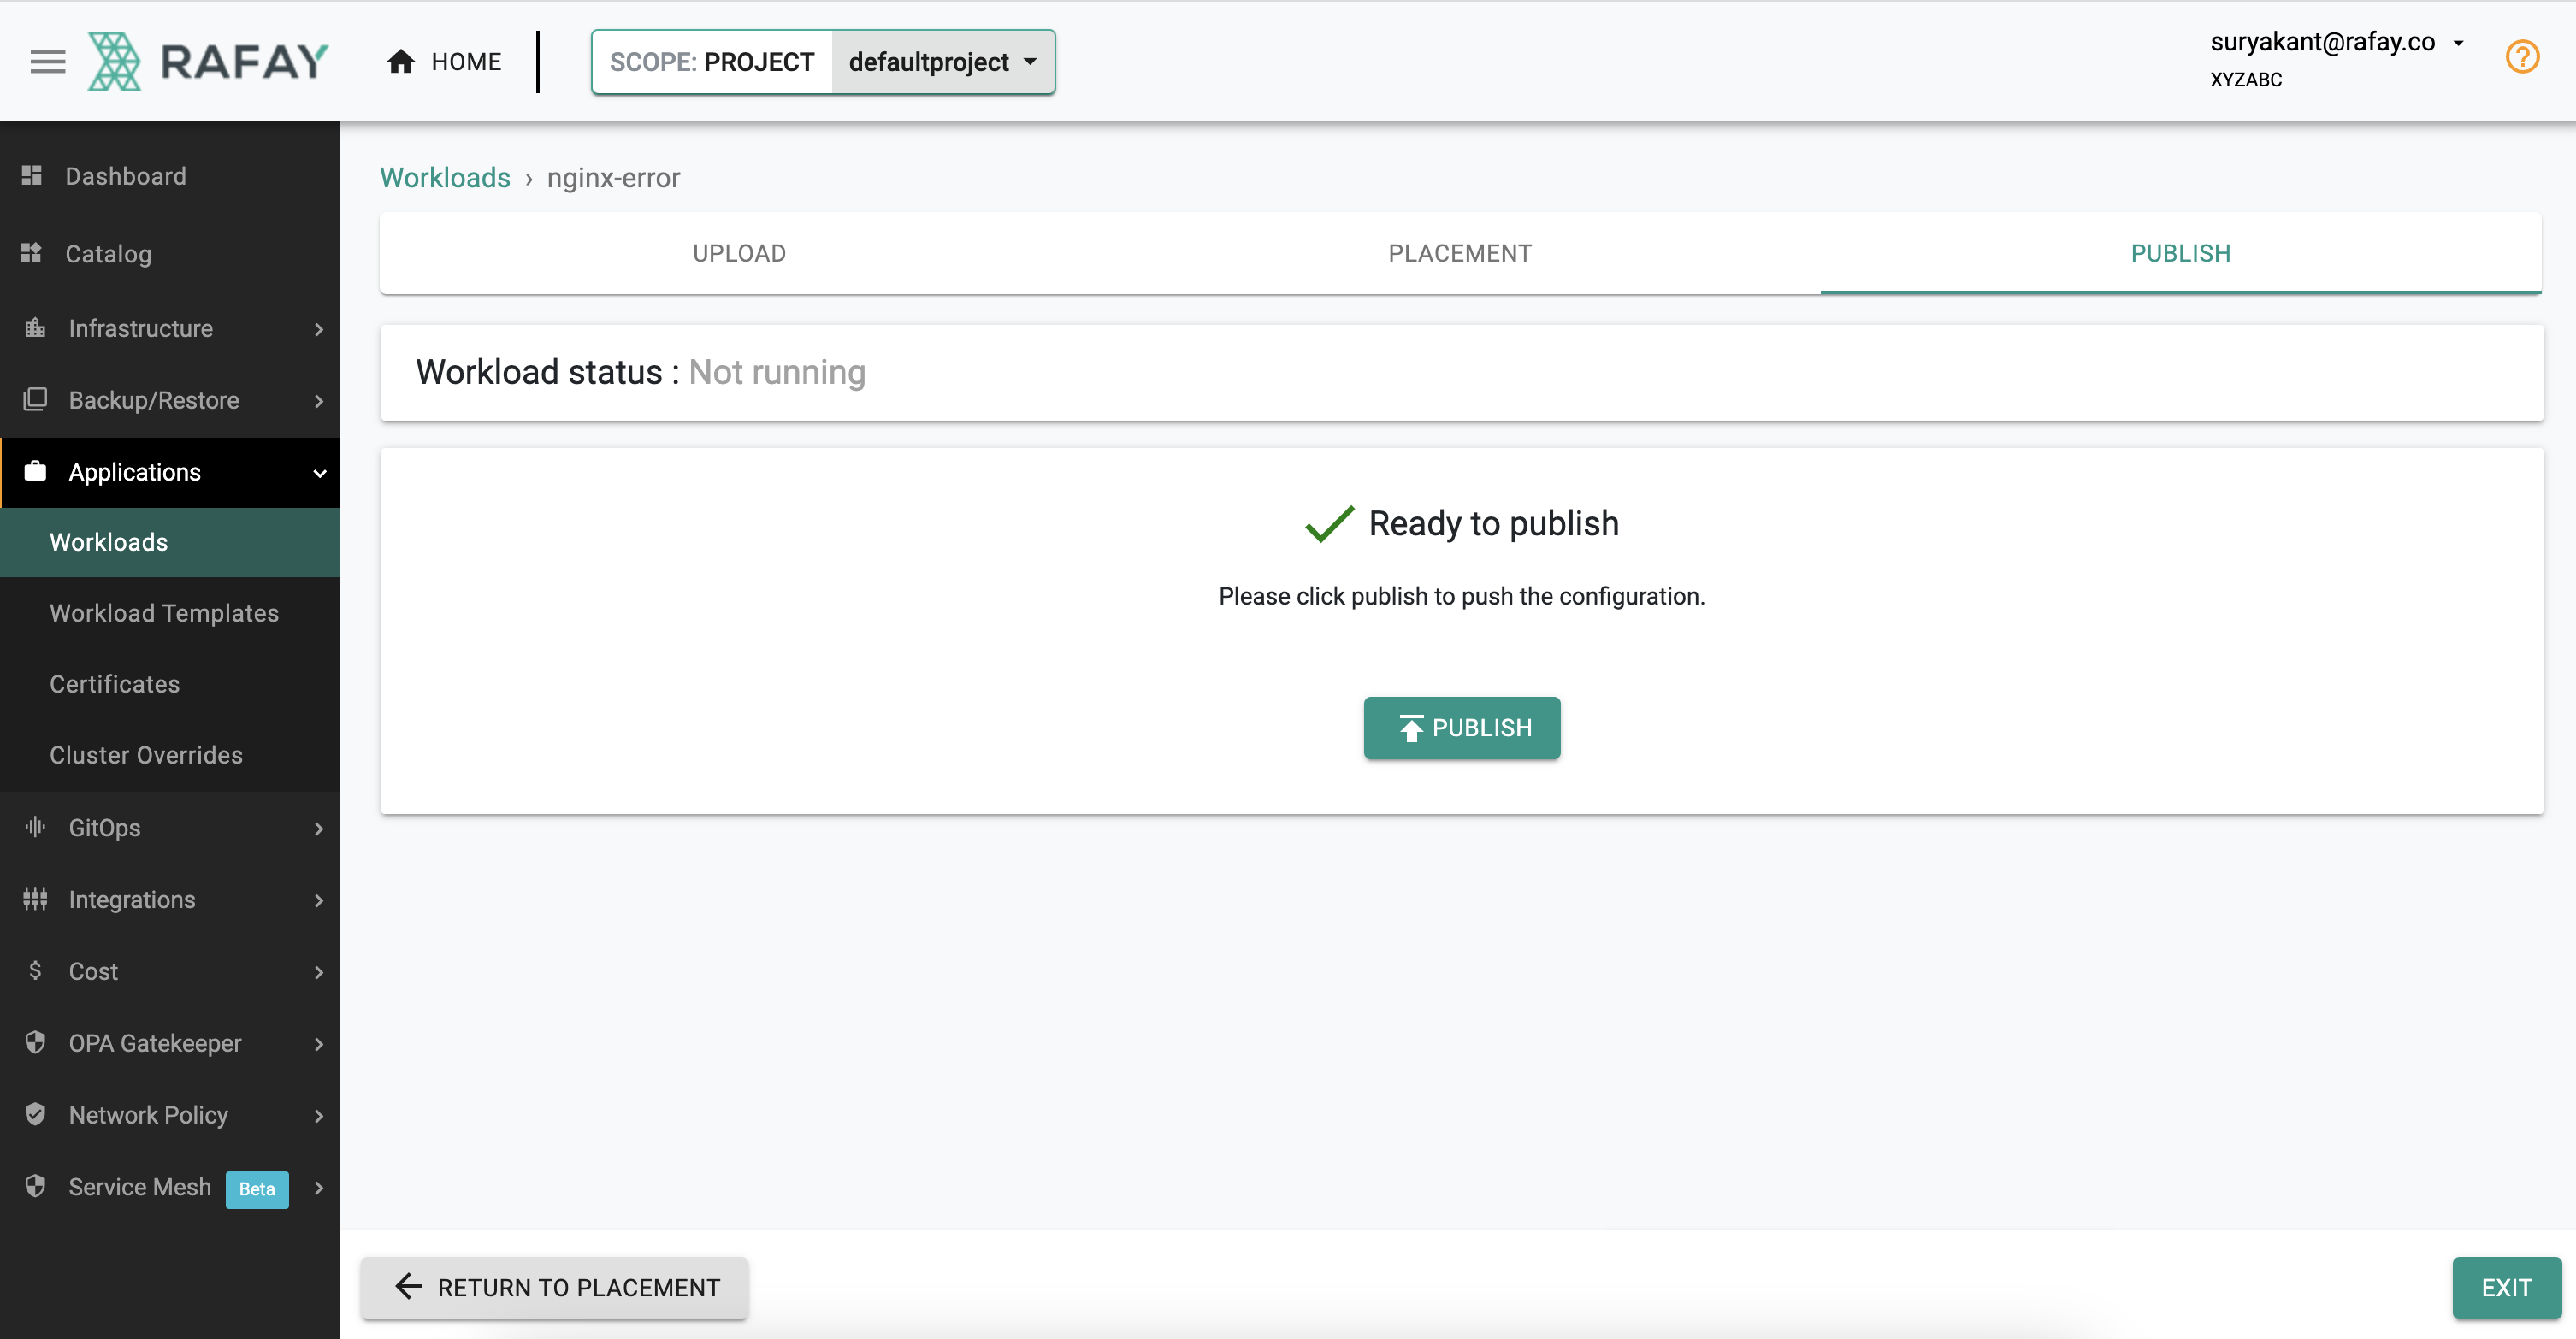
- On the Placement tab -> Select the Checkbox with cluster name -> Click " Save and Go To Publish" -> then Click " Publish"
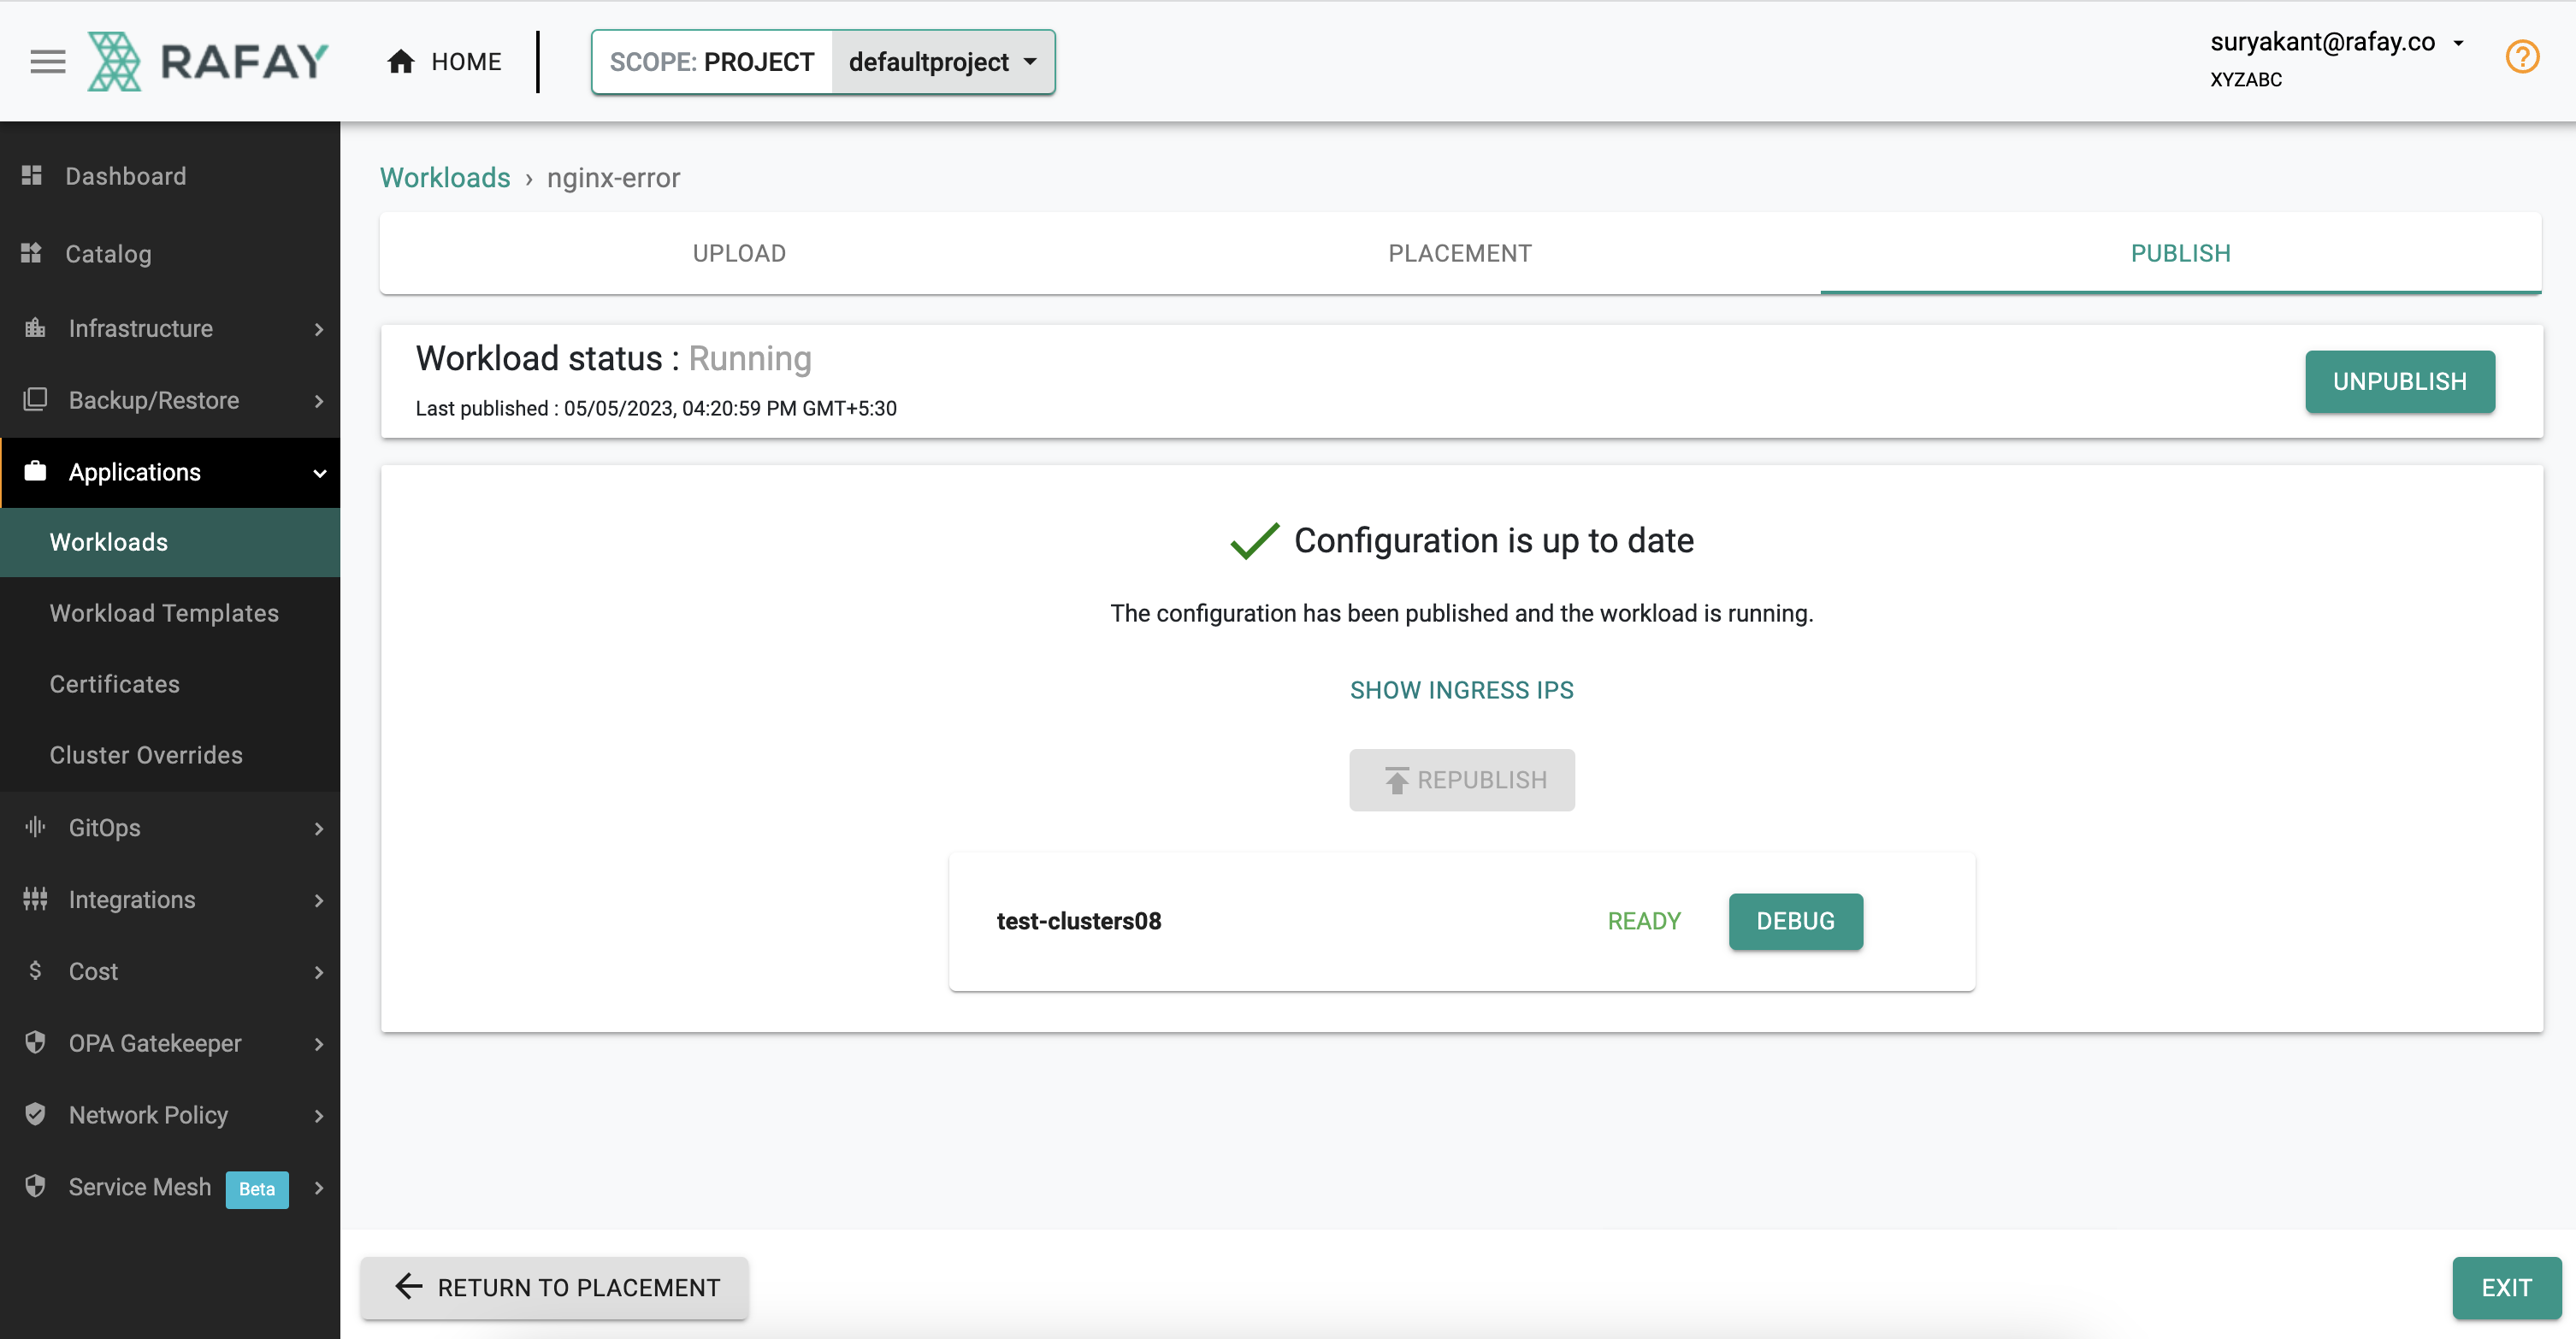
In a few minutes, the "visibility and monitoring" add-on deployed on the cluster by the platform will automatically detect the error condition and generate an alert.
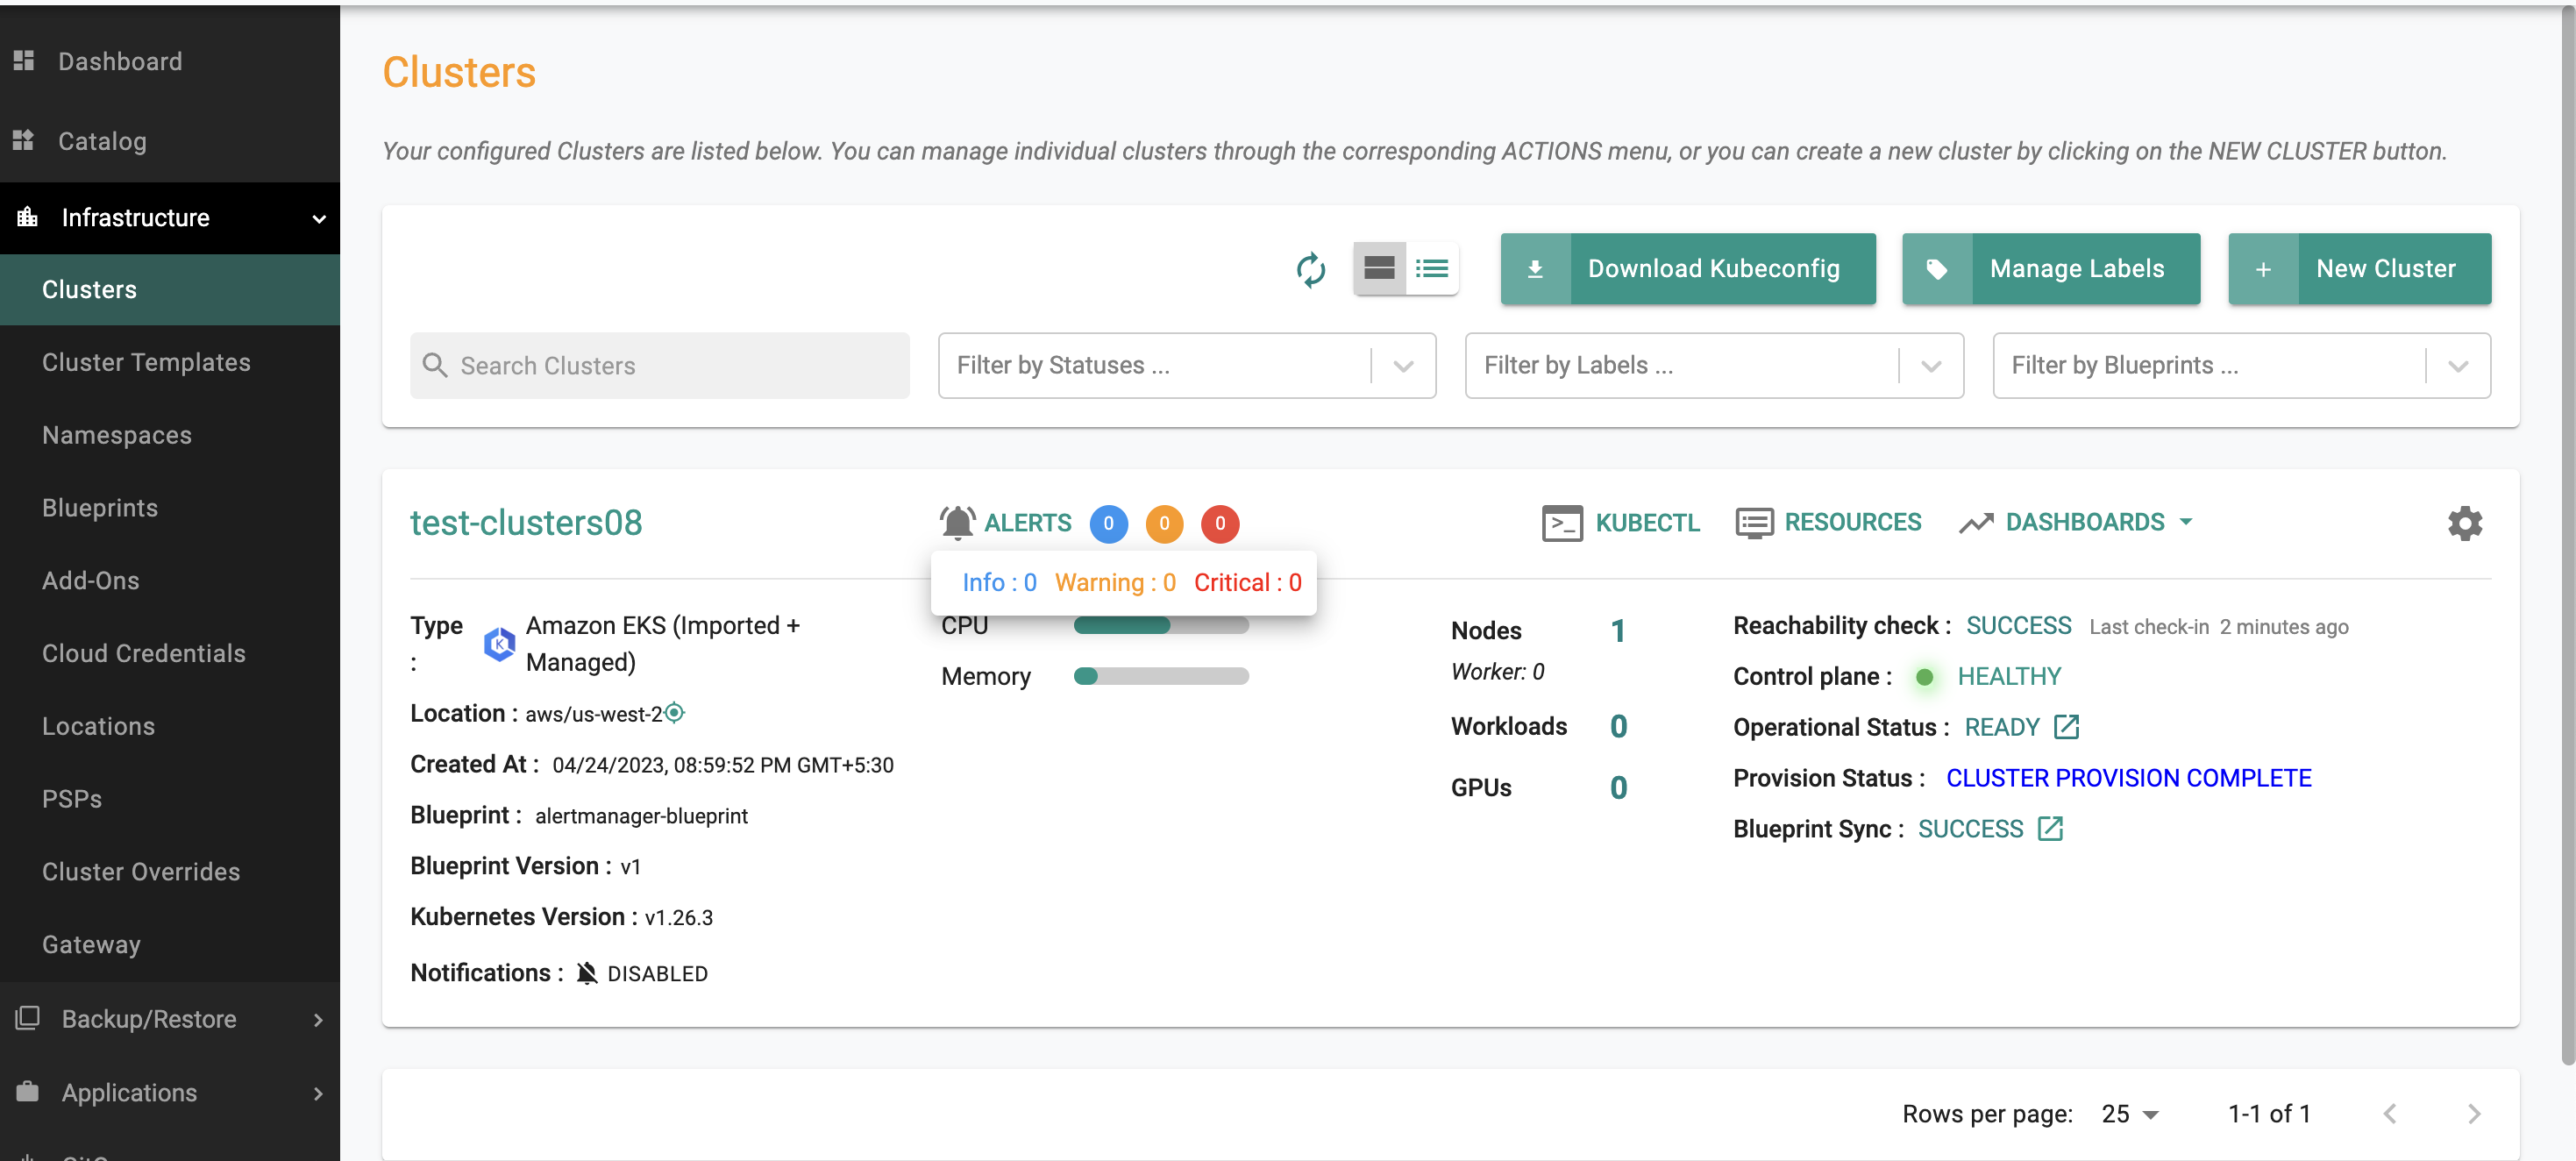
- Go back to Infrastructure -> Cluster, Click -> "Alerts" to check the Alerts:
Important
Alerts will be automatically cleared by the platform if it determines that the error condition is not detected anymore.
Recap
Congratulations! At this point, you have successfully simulated an error condition with a workload on your managed cluster and used the platform to centrally monitor and aggregate the alerts.