Grafana
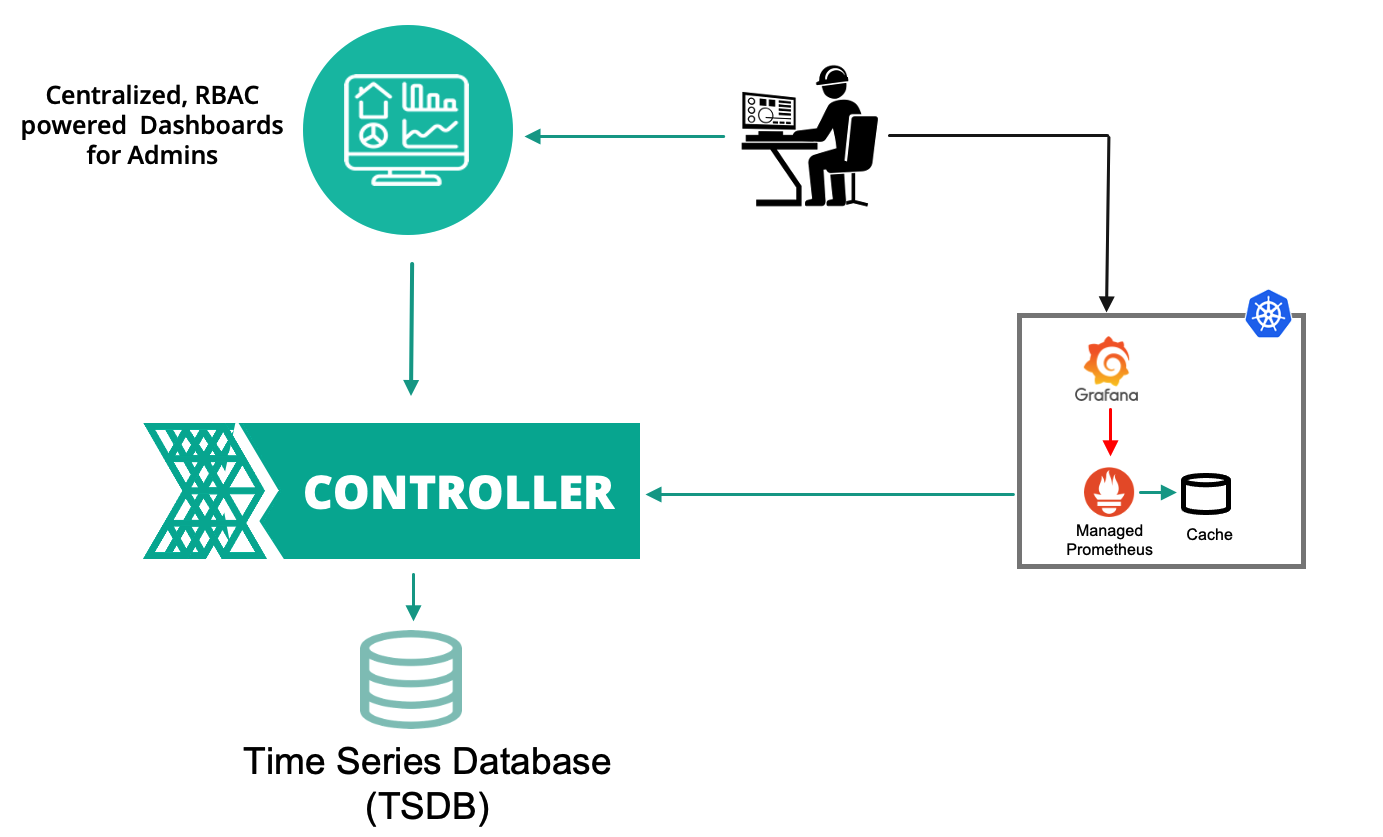
The controller provides integrated monitoring and visibility capabilities automatically deploying Prometheus and associated components on the managed Kubernetes clusters. In addition to the built in dashboards on the controller, some organizations may also wish to use a Grafana Dashboard for their Kubernetes clusters' visibility.
This recipe describes how customers can standardize the configuration, deployment and lifecycle management of Grafana across their fleet of clusters. The Grafana Helm Chart needs to be deployed on every Kubernetes cluster that you would like to use Grafana dashboard. The Grafana dashboard will use data from the "managed" Prometheus addons on the clusters.
What Will You Do
In this exercise,
- You will create a customized "grafana" addon using Grafana "official Helm chart"
- You will use the addon in a custom cluster blueprint
- You will then apply this cluster blueprint to a managed cluster
Important
This recipe describes the steps to create and use a custom cluster blueprint using the Web Console. The entire workflow can also be fully automated and embedded into an automation pipeline.
Assumptions
- You have already provisioned or imported one or more Kubernetes clusters using the controller.
- You will be using the controller managed Ingress Controller addon to expose the Grafana service outside the clusters
- You will use cert-manager to manage the certificate lifecycle for the TLS certificates
Step 1: Download Helm Chart
We will be using the Grafana Helm chart from the official repository. In this example, we will be using version 6.9.1 of the Grafana Helm Chart.
- Login into the Web Console and navigate to your Project as an Org Admin or Infrastructure Admin
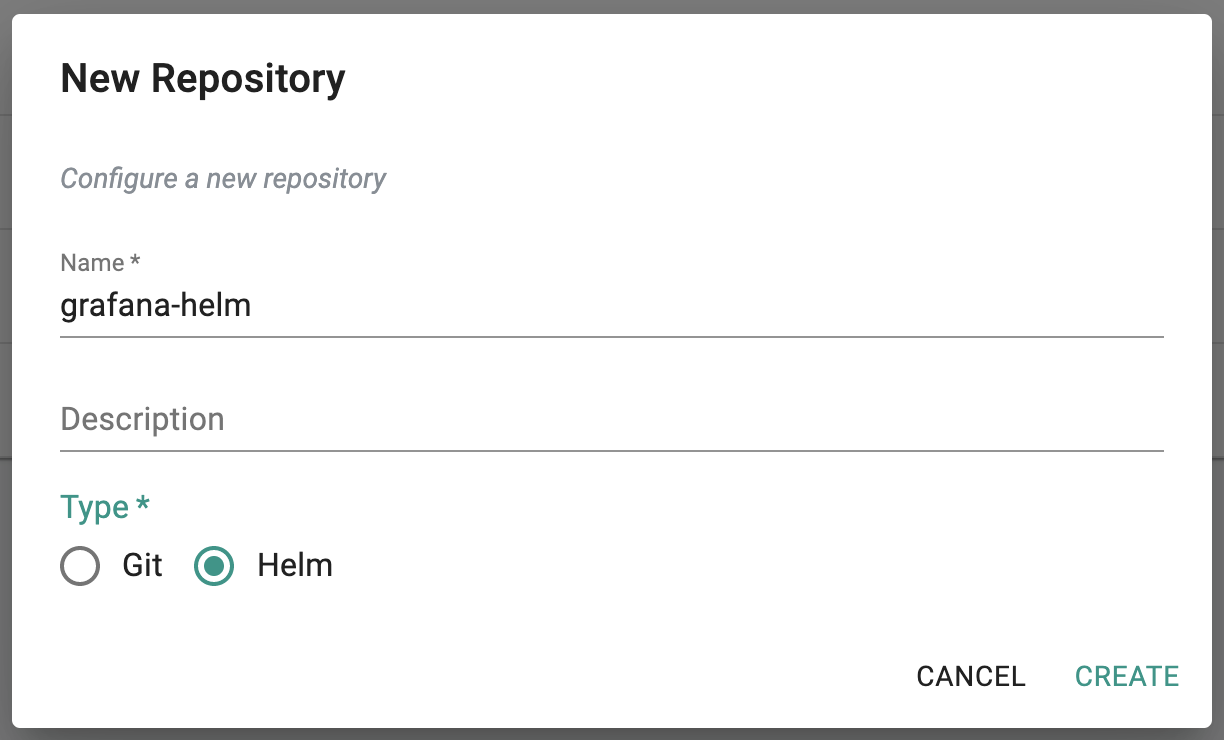
- Navigate to Integrations > Repositories to add a new helm repository.
- Enter name "grafana-helm" for this repository integration and select type as "Helm"
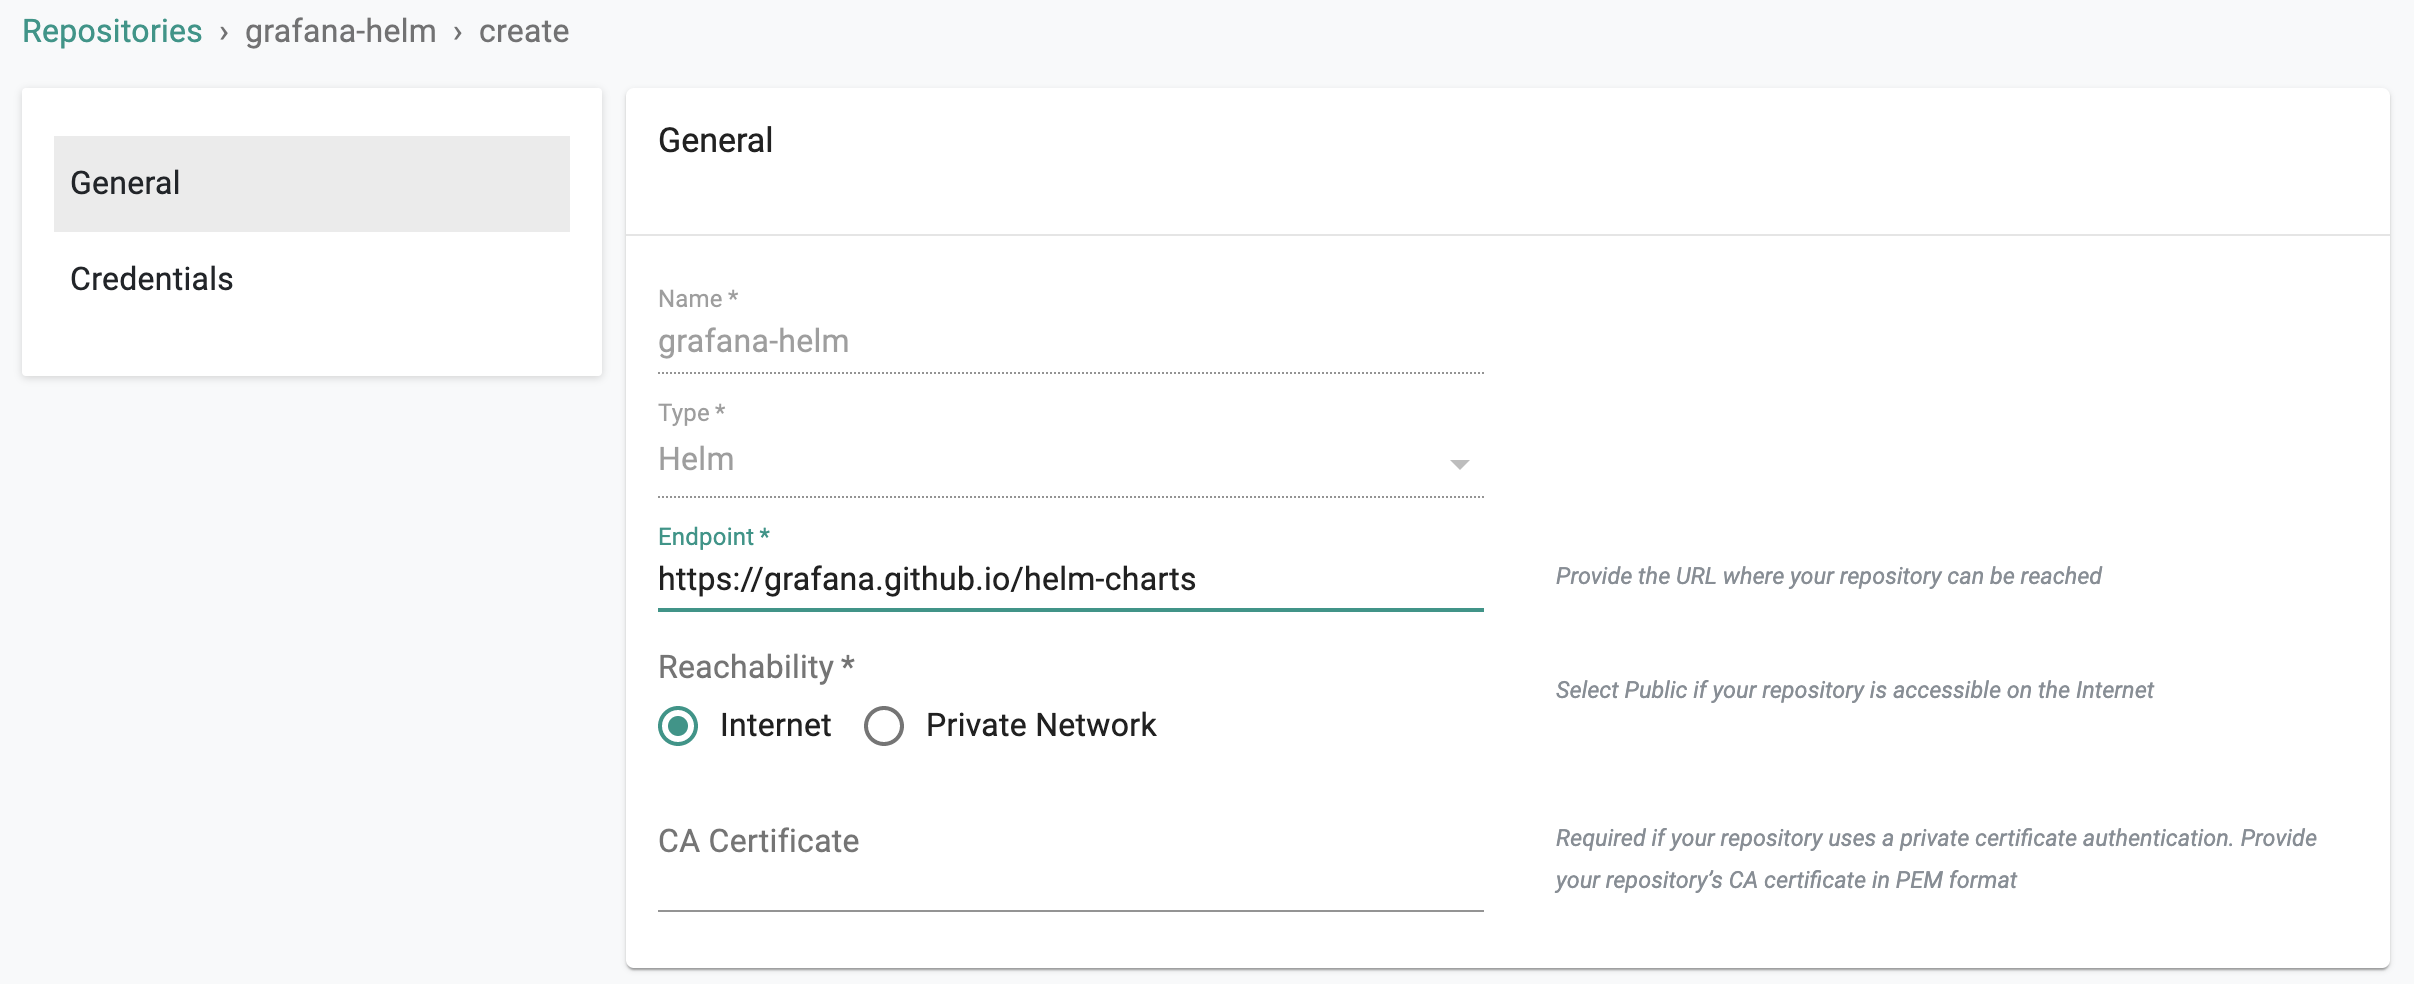
- Configure the helm repo endpoints to use Grafana helm repo URL "https://grafana.github.io/helm-charts" and Save the configuration
Step 2: Customize Values
The Grafana Helm chart comes with a default values.yaml file. We will be customizing the defaults with our own override "values.yaml". Copy the details below into a file named "grafana-custom-values.yaml" and make necessary changes for your environment. See highlighted rows for required changes.
## Custom values for Grafana
## Test framework configuration
testFramework:
  enabled: false

## Pod Annotations
podAnnotations: {}

## Deployment annotations
annotations: {}

## Service - set to type: LoadBalancer to expose service via load balancing instead of using ingress
service:
  enabled: true
  type: ClusterIP
  annotations: {}
  labels: {}

## Ingress configuration to expose Grafana to external using ingress
ingress:
  enabled: true
  annotations:
    kubernetes.io/ingress.class: nginx
    cert-manager.io/cluster-issuer: "letsencrypt-http01"
  labels: {}
  path: /
  hosts:
    - grafana-dashboard.mycompany.com
  extraPaths: []
  tls:
  - secretName: grafana-dashboard-tls
    hosts:
      - grafana-dashboard.mycompany.com

## Resource Limits and Requests settings
resources: {}
#  limits:
#    cpu: 100m
#    memory: 128Mi
#  requests:
#    cpu: 100m
#    memory: 128Mi

## Node labels for pod assignment
nodeSelector: {}

## Tolerations for pod assignment
tolerations: []

## Affinity for pod assignment
affinity: {}

## Enable persistence using Persistent Volume Claims
persistence:
  type: pvc
  enabled: true
  # storageClassName: default
  accessModes:
    - ReadWriteOnce
  size: 10Gi
  # annotations: {}
  # existingClaim:

# Administrator credentials when not using an existing secret (see below)
adminUser: admin
# adminPassword: strongpassword

# Use an existing secret for the admin user.
admin:
  existingSecret: ""
  userKey: admin-user
  passwordKey: admin-password

## Extra environment variables
env: {}
envValueFrom: {}
envFromSecret: ""

## Configure Grafana datasources to point to Rafay Prometheus Service
datasources:
 datasources.yaml:
   apiVersion: 1
   datasources:
   - name: Rafay-Prometheus
     type: prometheus
     url: http://rafay-prometheus-server.rafay-infra.svc.cluster.local:9090
     access: proxy
     isDefault: true

## Configure Grafana dashboard providers for importing dashboards by defaults
dashboardProviders:
  dashboardproviders.yaml:
    apiVersion: 1
    providers:
    - name: 'default'
      orgId: 1
      folder: ''
      type: file
      disableDeletion: false
      editable: true
      options:
        path: /var/lib/grafana/dashboards/default

## Configure grafana dashboard to import by default. gnetId is dashboard ID from https://grafana.com/grafana/dashboards
dashboards:
  default:
    k8sClusterDashboard:
      gnetId: 7249
      datasource: Rafay-Prometheus
    k8sClusterResource:
      gnetId: 12114
      datasource: Rafay-Prometheus
    k8sNamespaceResource:
      gnetId: 12117
      datasource: Rafay-Prometheus
    k8sPodResource:
      gnetId: 12120
      datasource: Rafay-Prometheus
    k8sNodeResource:
      gnetId: 12119
      datasource: Rafay-Prometheus
    k8sNodeExporter:
      gnetId: 11074
      datasource: Rafay-Prometheus
    k8sDeployStsDs:
      gnetId: 8588
      datasource: Rafay-Prometheus
    k8sAppMetrics:
      gnetId: 1471
      datasource: Rafay-Prometheus
    k8sNetworkingCluster:
      gnetId: 12124
      datasource: Rafay-Prometheus
    k8sNetworkingNamespace:
      gnetId: 12125
      datasource: Rafay-Prometheus
    k8sNetworkingPod:
      gnetId: 12661
      datasource: Rafay-Prometheus
    ## Or other custom dashboards
    #   custom-dashboard:
    #     file: dashboards/custom-dashboard.json
    #   prometheus-stats:
    #     gnetId: 2
    #     revision: 2
    #     datasource: Prometheus
    #   local-dashboard:
    #     url: https://example.com/repository/test.json
    #     token: ''
    #   local-dashboard-base64:
    #     url: https://example.com/repository/test-b64.json
    #     token: ''
    #     b64content: true
Step 3: Create Addon
- Login into the Web Console and navigate to your Project as an Org Admin or Infrastructure Admin
- Under Infrastructure, select "Namespaces" and create a new namespace called "monitoring"
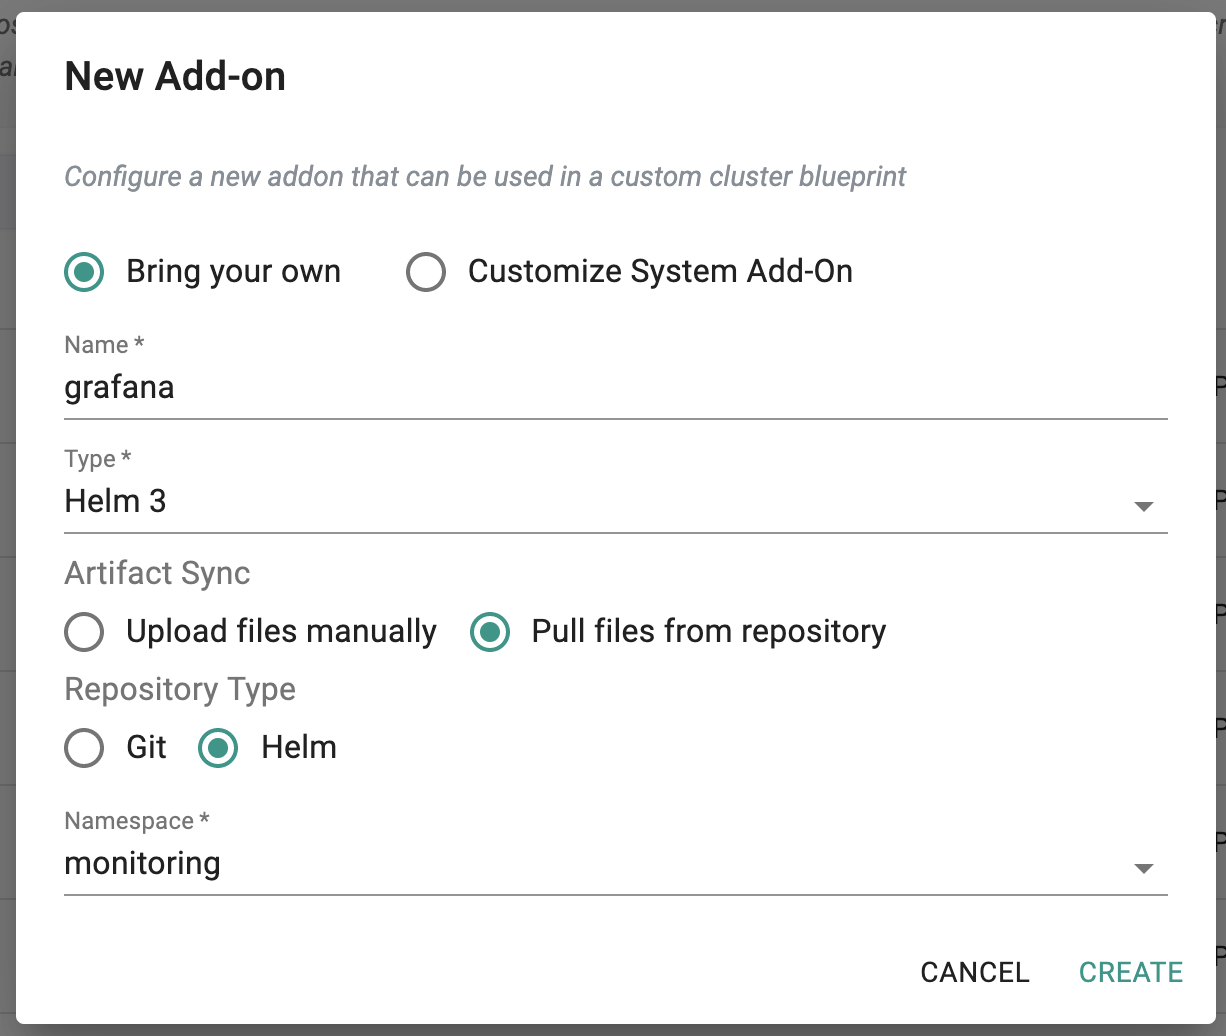
- Select "Addons" and "Create" a new Addon called "grafana"
- Ensure that you select "Helm 3" for type, enable "Pull files from repository", set repository type as "Helm" and select the namespace as "monitoring"
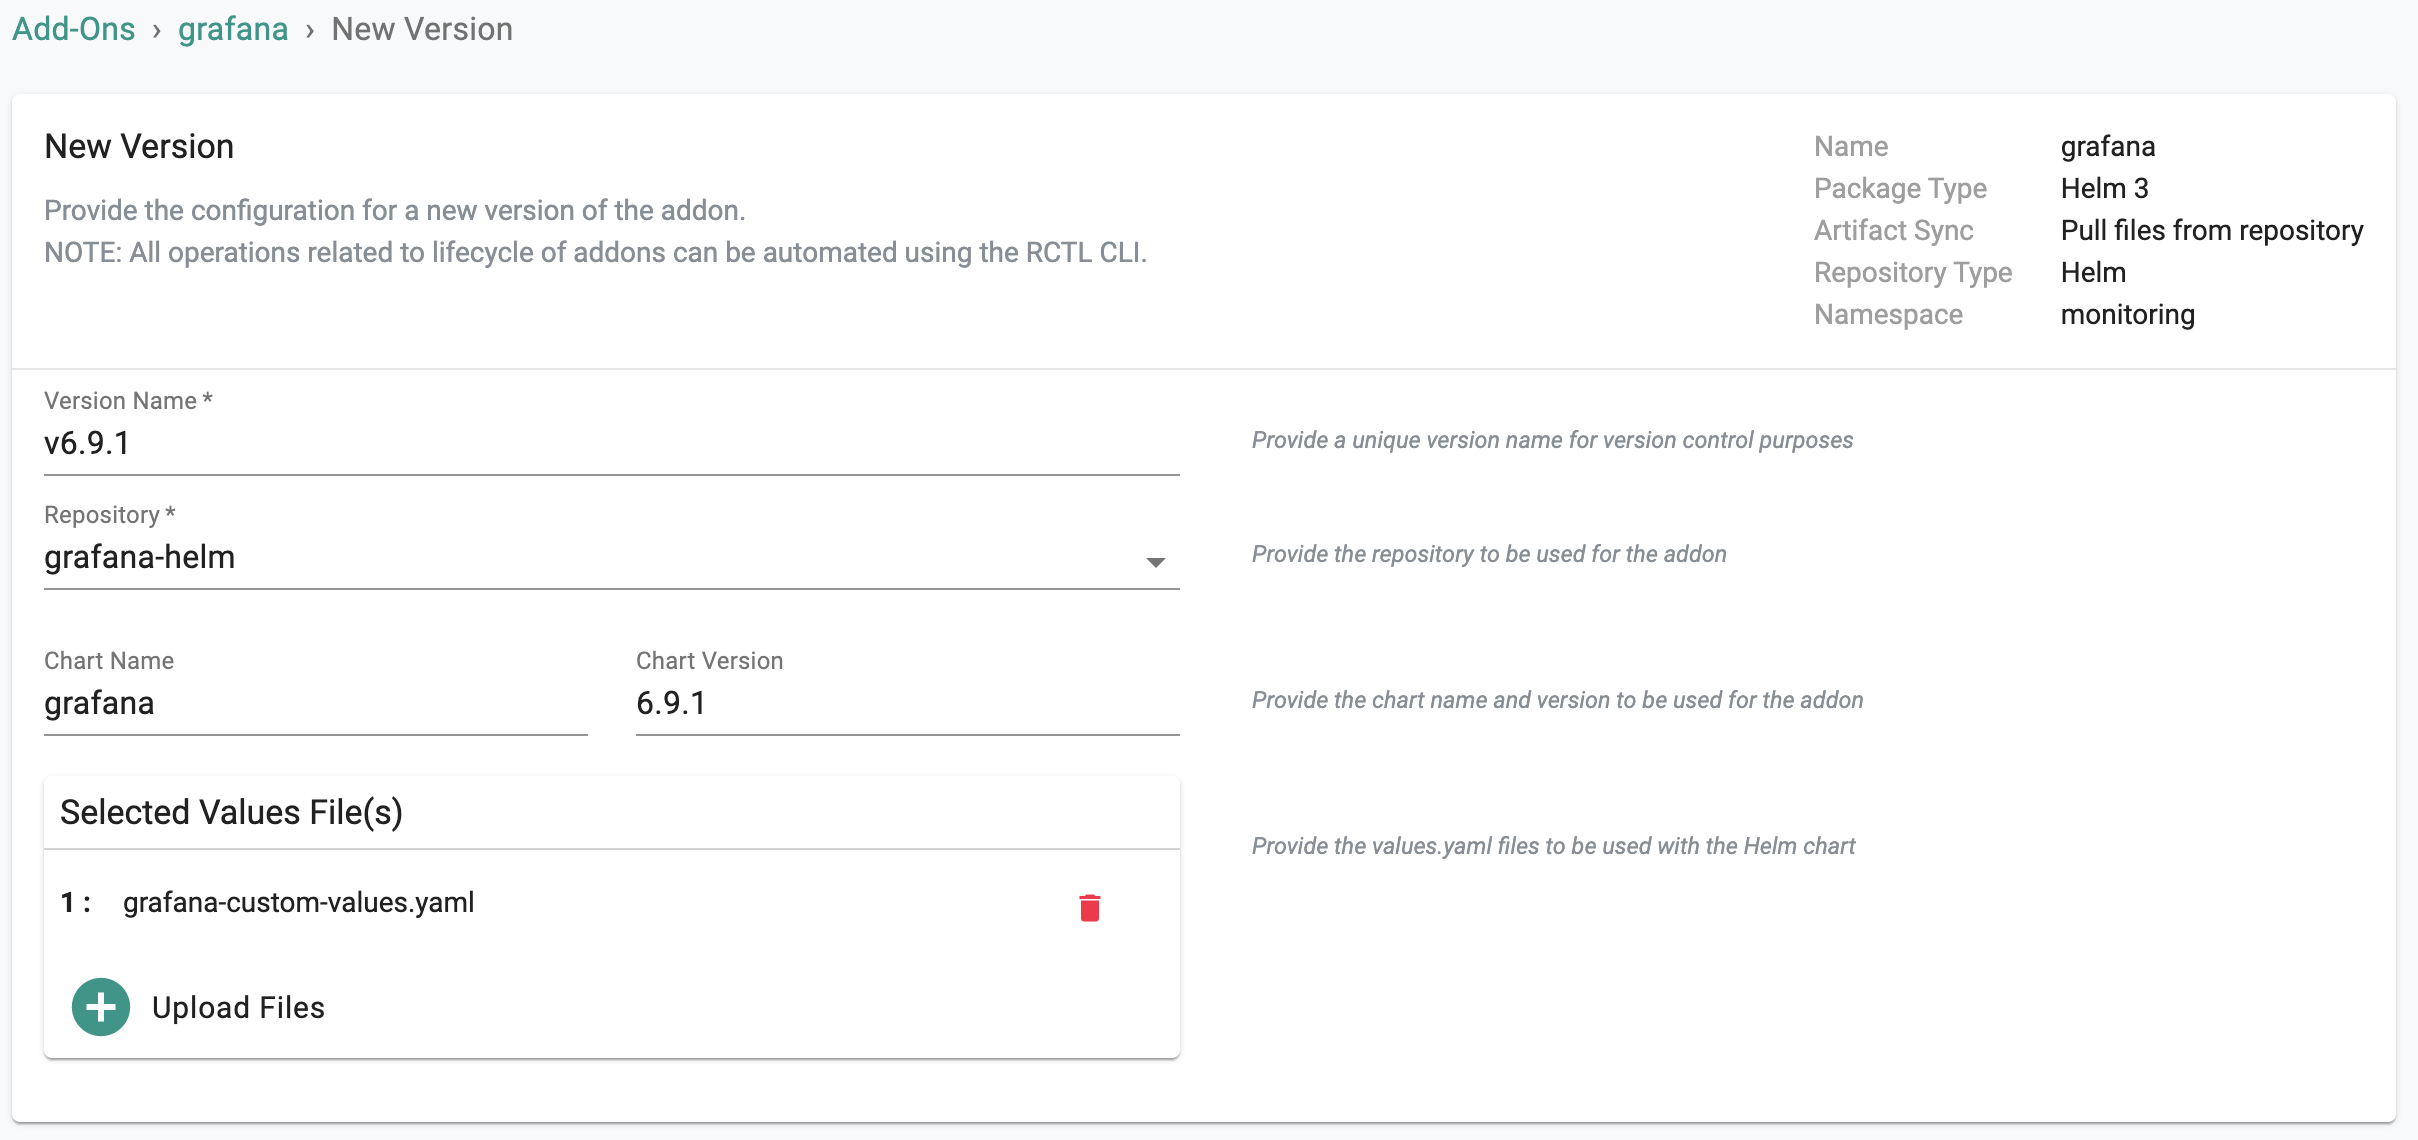
- Create a new addon version
- Give the addon version a name, select the "grafana-helm" from repository dropdown list, enter the chart name "grafana" and version "6.9.1" or leave empty for latest version. Then upload "grafana-custom-values.yaml" file for values and Save Changes
Step 4: Create Blueprint
Now, we are ready to assemble a custom cluster blueprint using the newly created Grafana addon. You can add other addons to the same custom blueprint.
- Under Infrastructure, select "Blueprints"
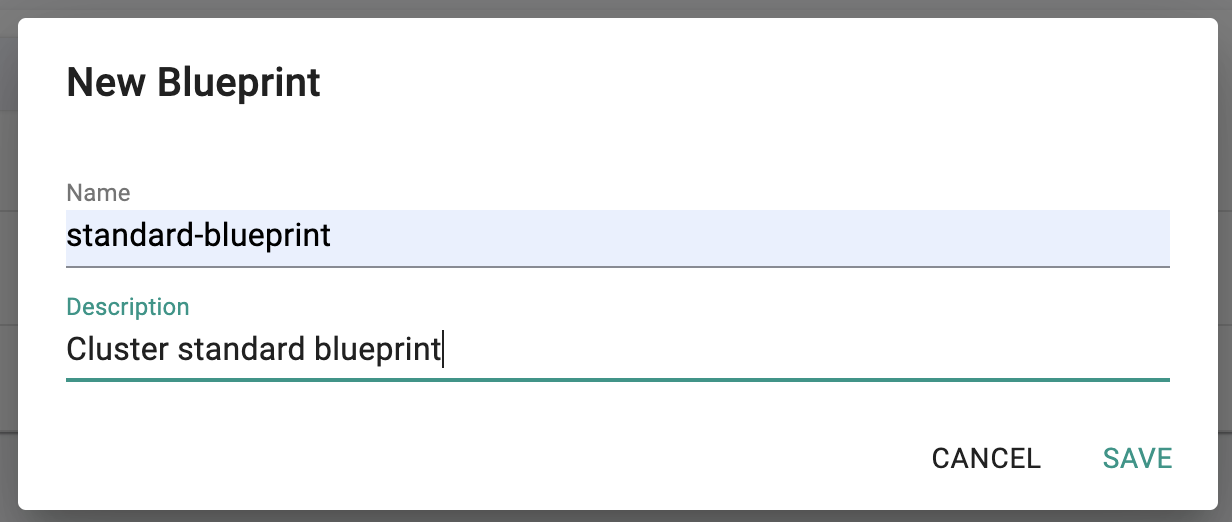
- Create a new blueprint and give it a name such as "standard-blueprint"
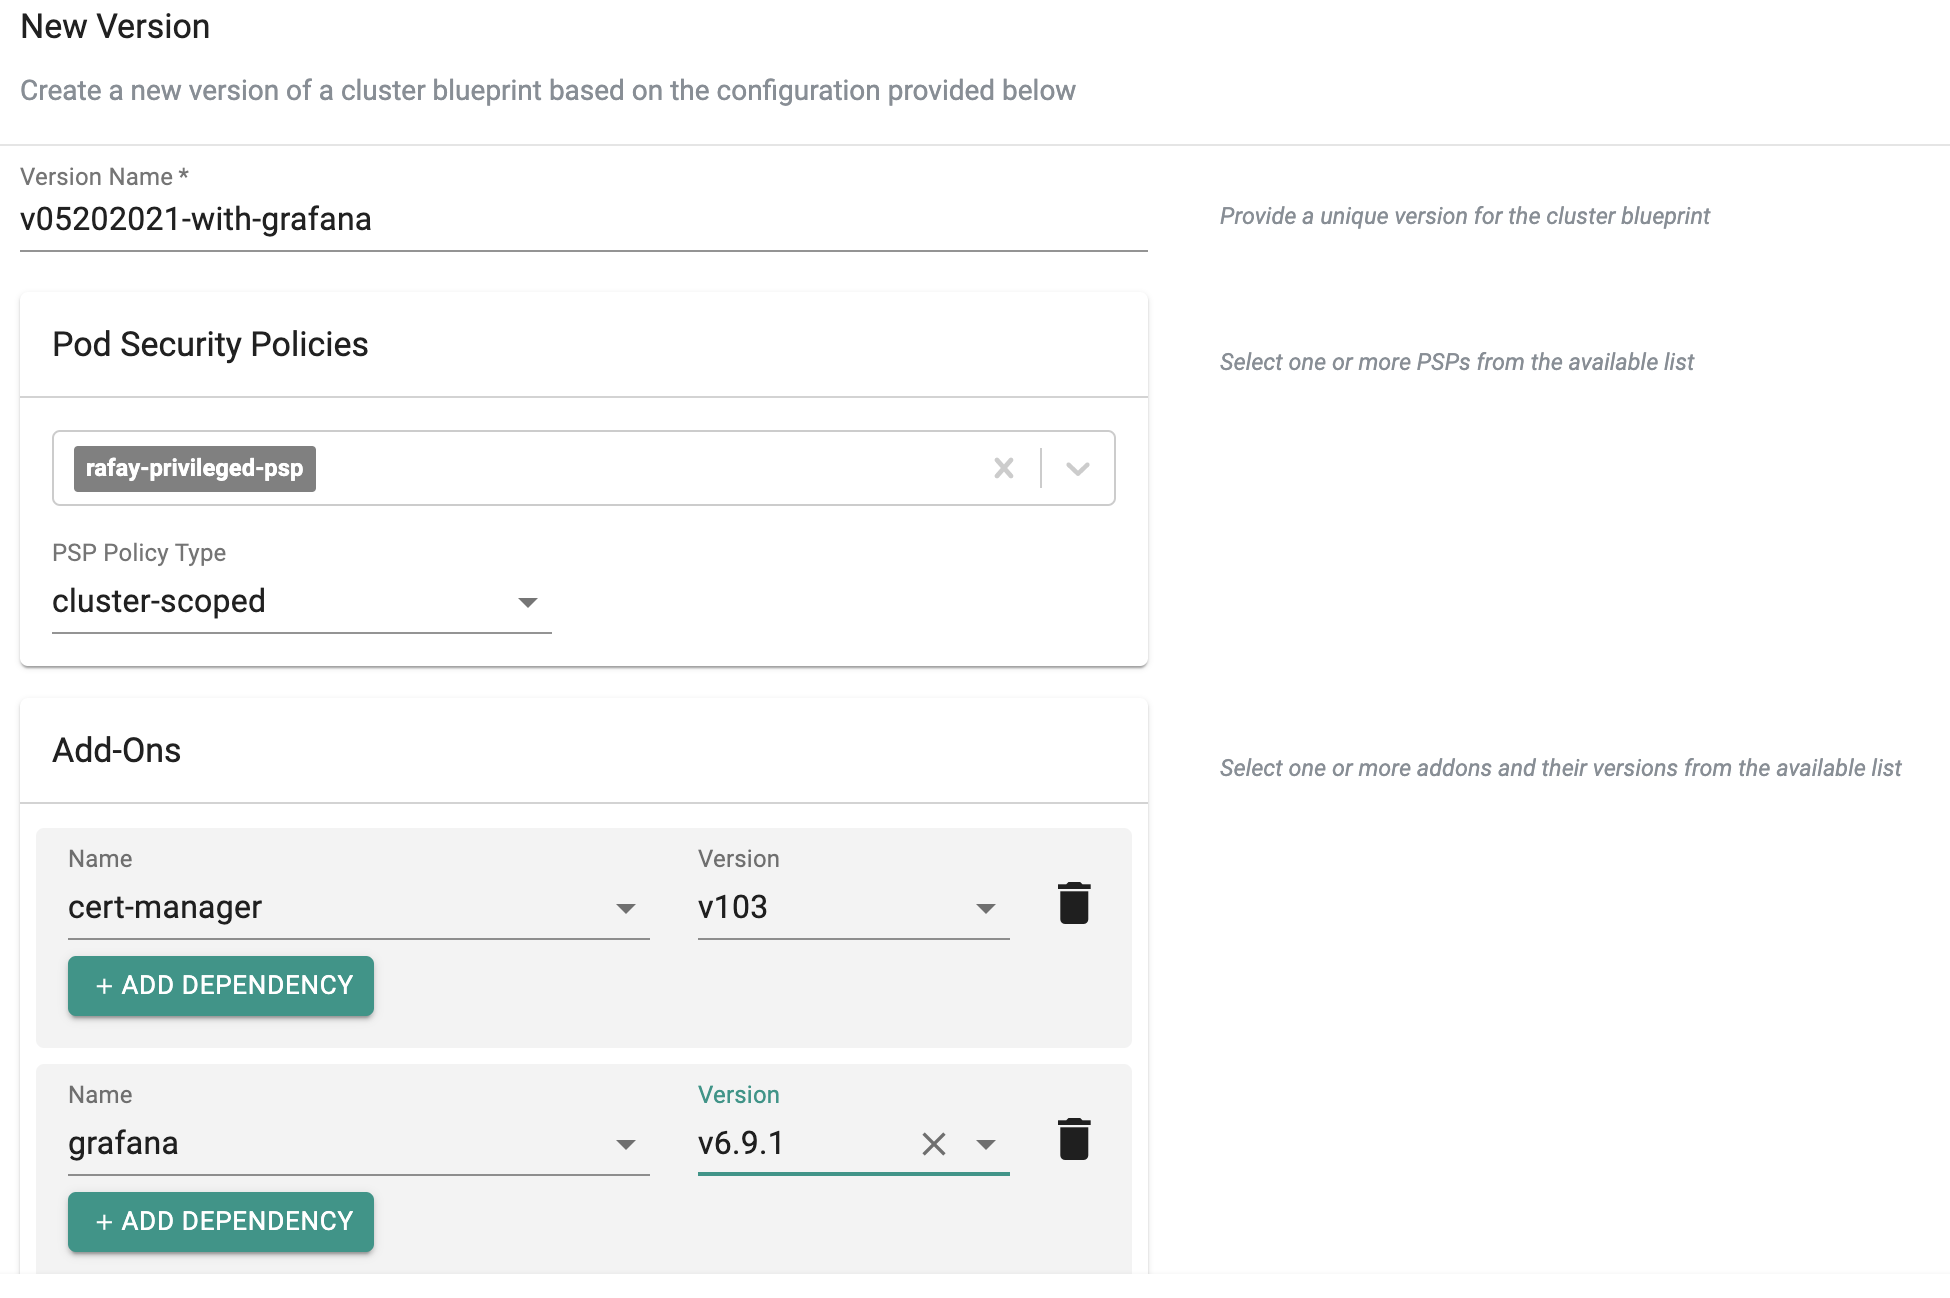
- Create a new version for the Blueprint
- Enter the version name
- Select the grafana and other addons as required and Saves Changes
Step 5: Apply Blueprint
Now, we are ready to apply this custom blueprint to a cluster.
- Click on Options for the target Cluster in the Web Console
- Select "Update Blueprint" and select the "standard-blueprint" blueprint and version we created from the list
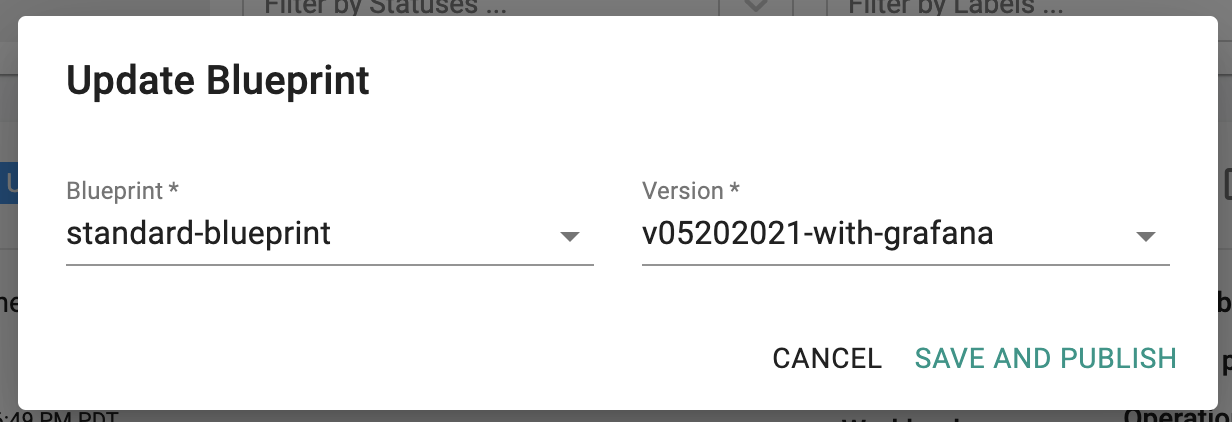
- Click on "Save and Publish".
This will start the deployment of the addons configured in the "standard-blueprint" blueprint to the targeted cluster. The blueprint sync process can take a few minutes. Once complete, the cluster will display the current cluster blueprint details and whether the sync was successful or not.
Step 6: Verify Deployment
Users can optionally verify whether the correct resources have been created on the cluster. Click on the Kubectl button on the cluster to open a virtual terminal
- First, we will verify if the "monitoring" namespace has been created
kubectl get ns monitoring
NAME         STATUS   AGE
monitoring   Active   43m
- Next, we will verify the pods in the "monitoring" namespace. You should see something like the example below that grafana pod is running.
kubectl get pod -n monitoring
NAME                      READY   STATUS    RESTARTS   AGE
grafana-cd656595d-9sf9h   1/1     Running   0          42m
kubectl
Step 7: Verify Data Collected
In order to verify the Grafana deployment and view the Grafana dashboards:
- Get the password to login to Grafana from the secret and do base64 decode of the admin-user and admin-password values to use to login to Grafana.
kubectl get secret -n monitoring grafana -o yaml
apiVersion: v1
data:
  admin-password: xxxxxxxxxxxxxxxxxxx
  admin-user: YWRtaW4=
- Open your Grafana in the browser and login using the above admin credential. After login, you should see the default dashboards shown in the Grafana Dashboard list as illustrative example below:
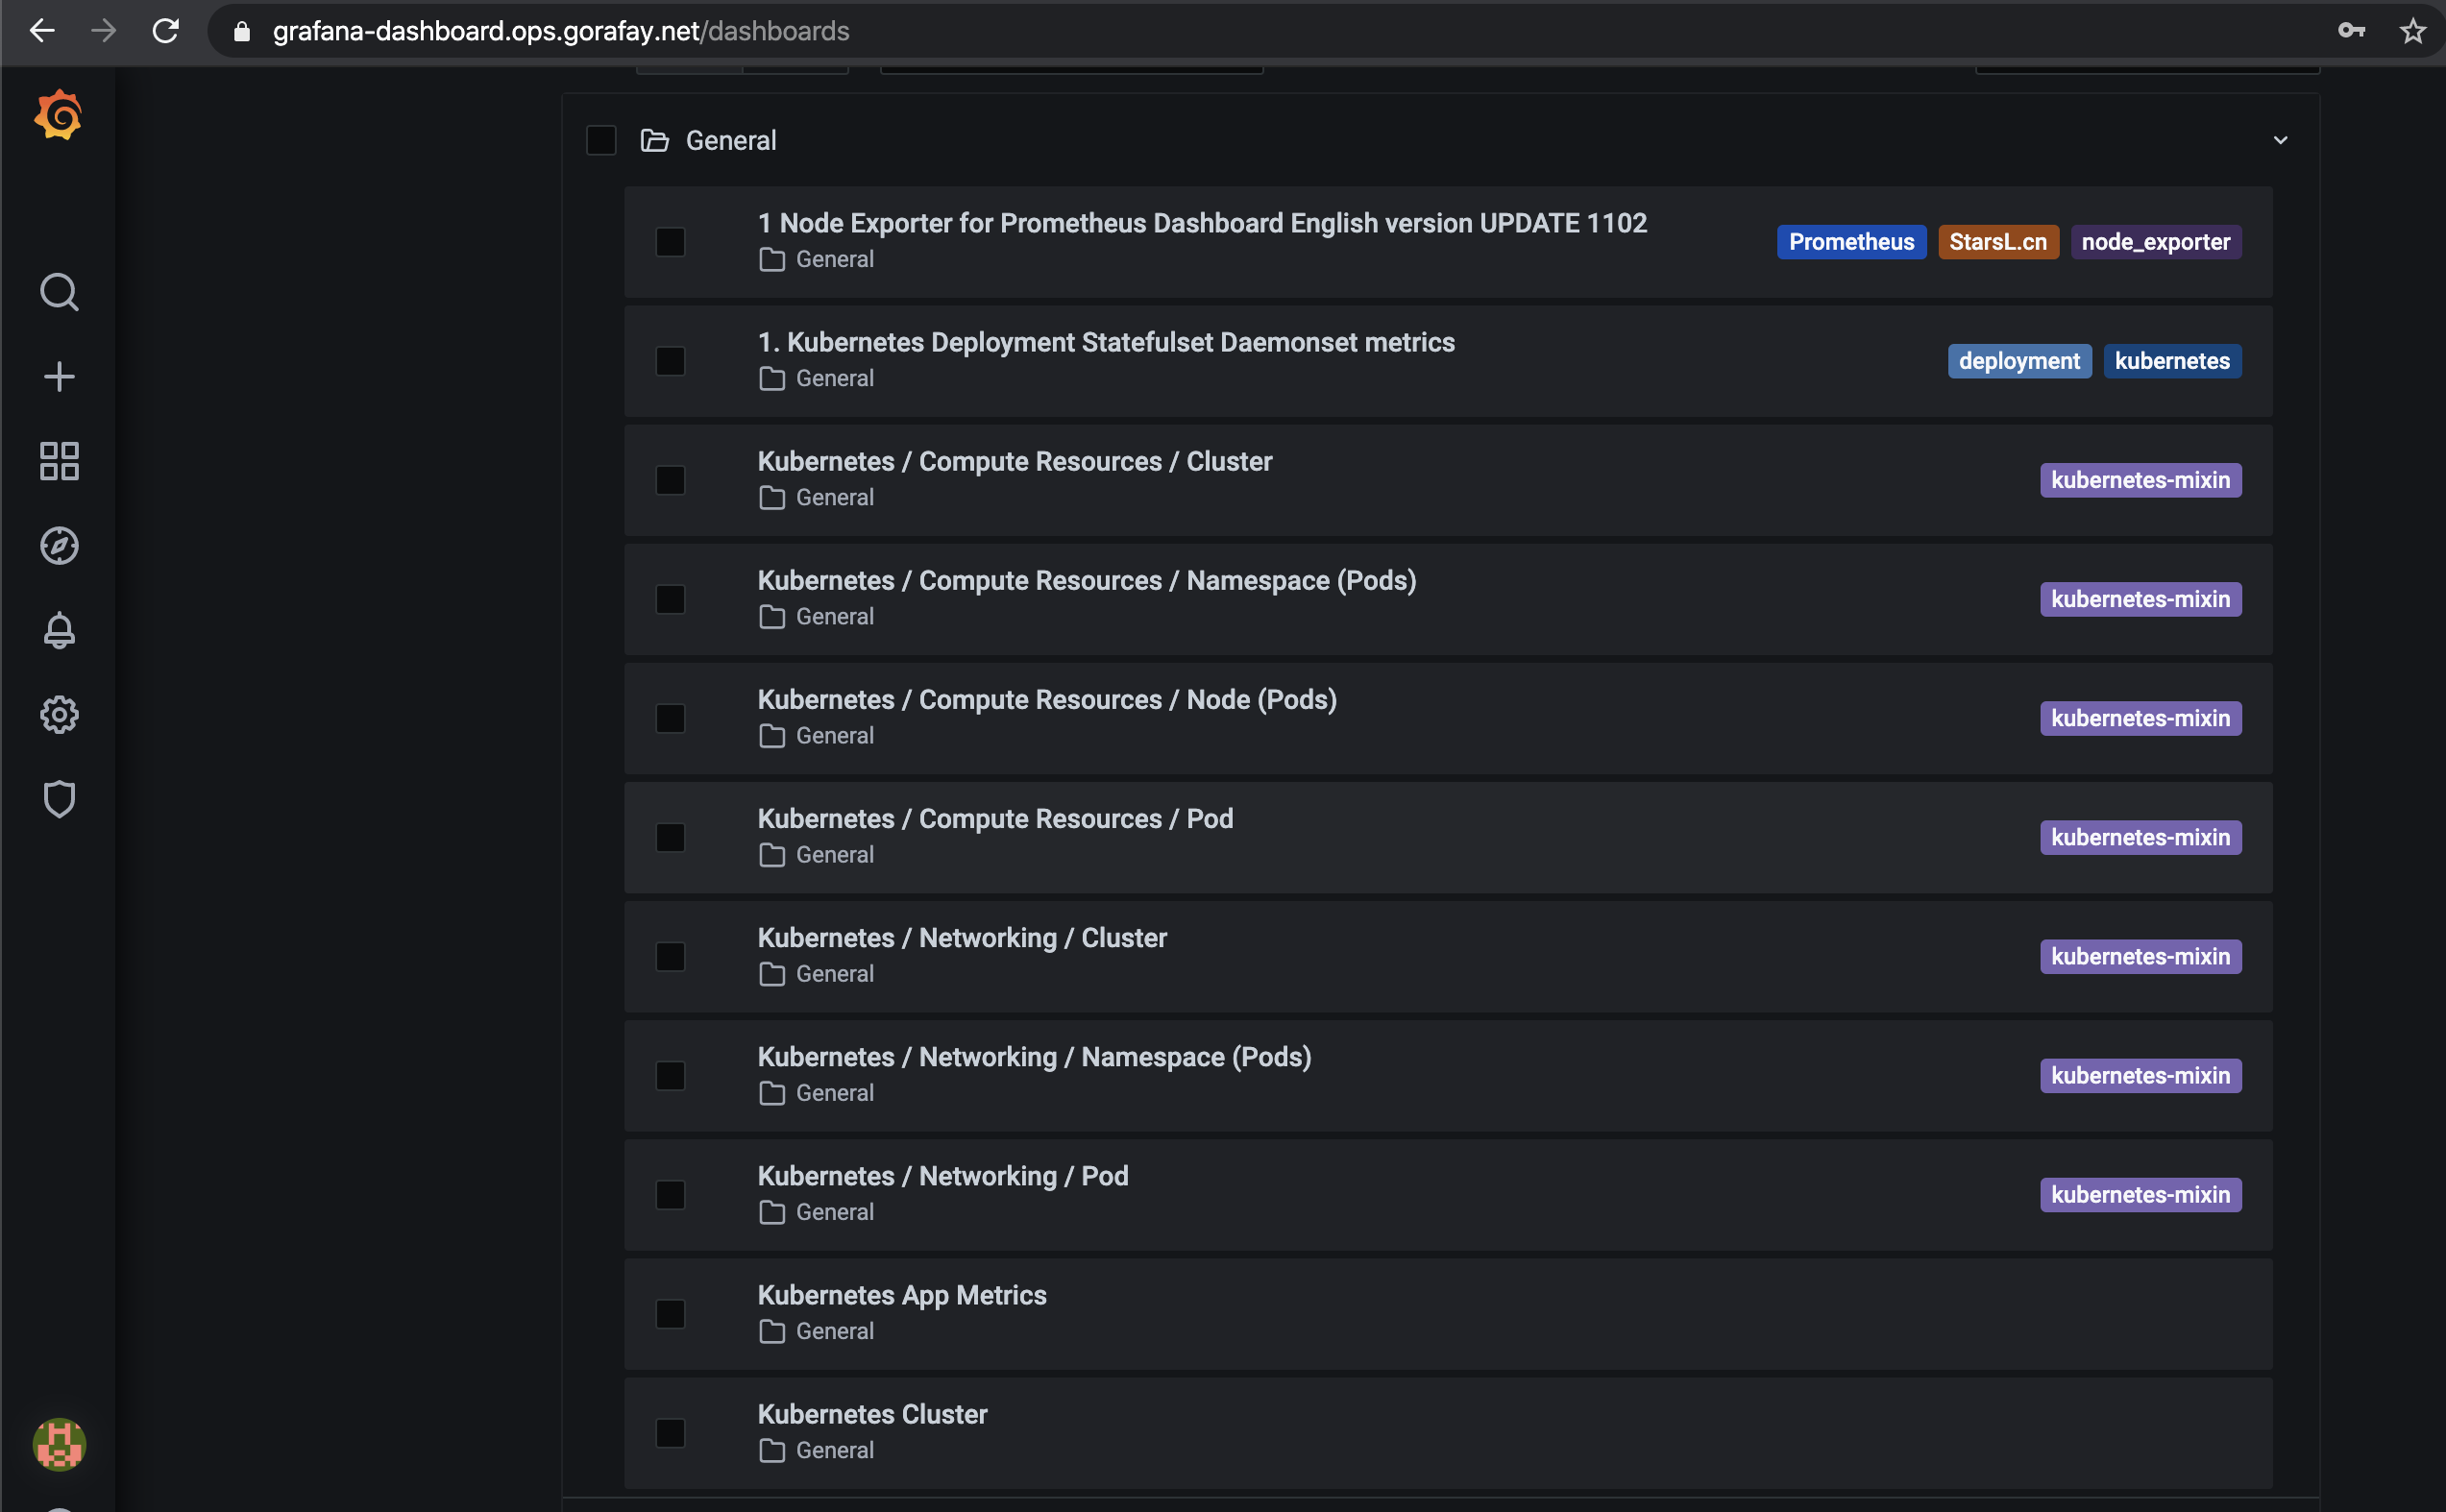
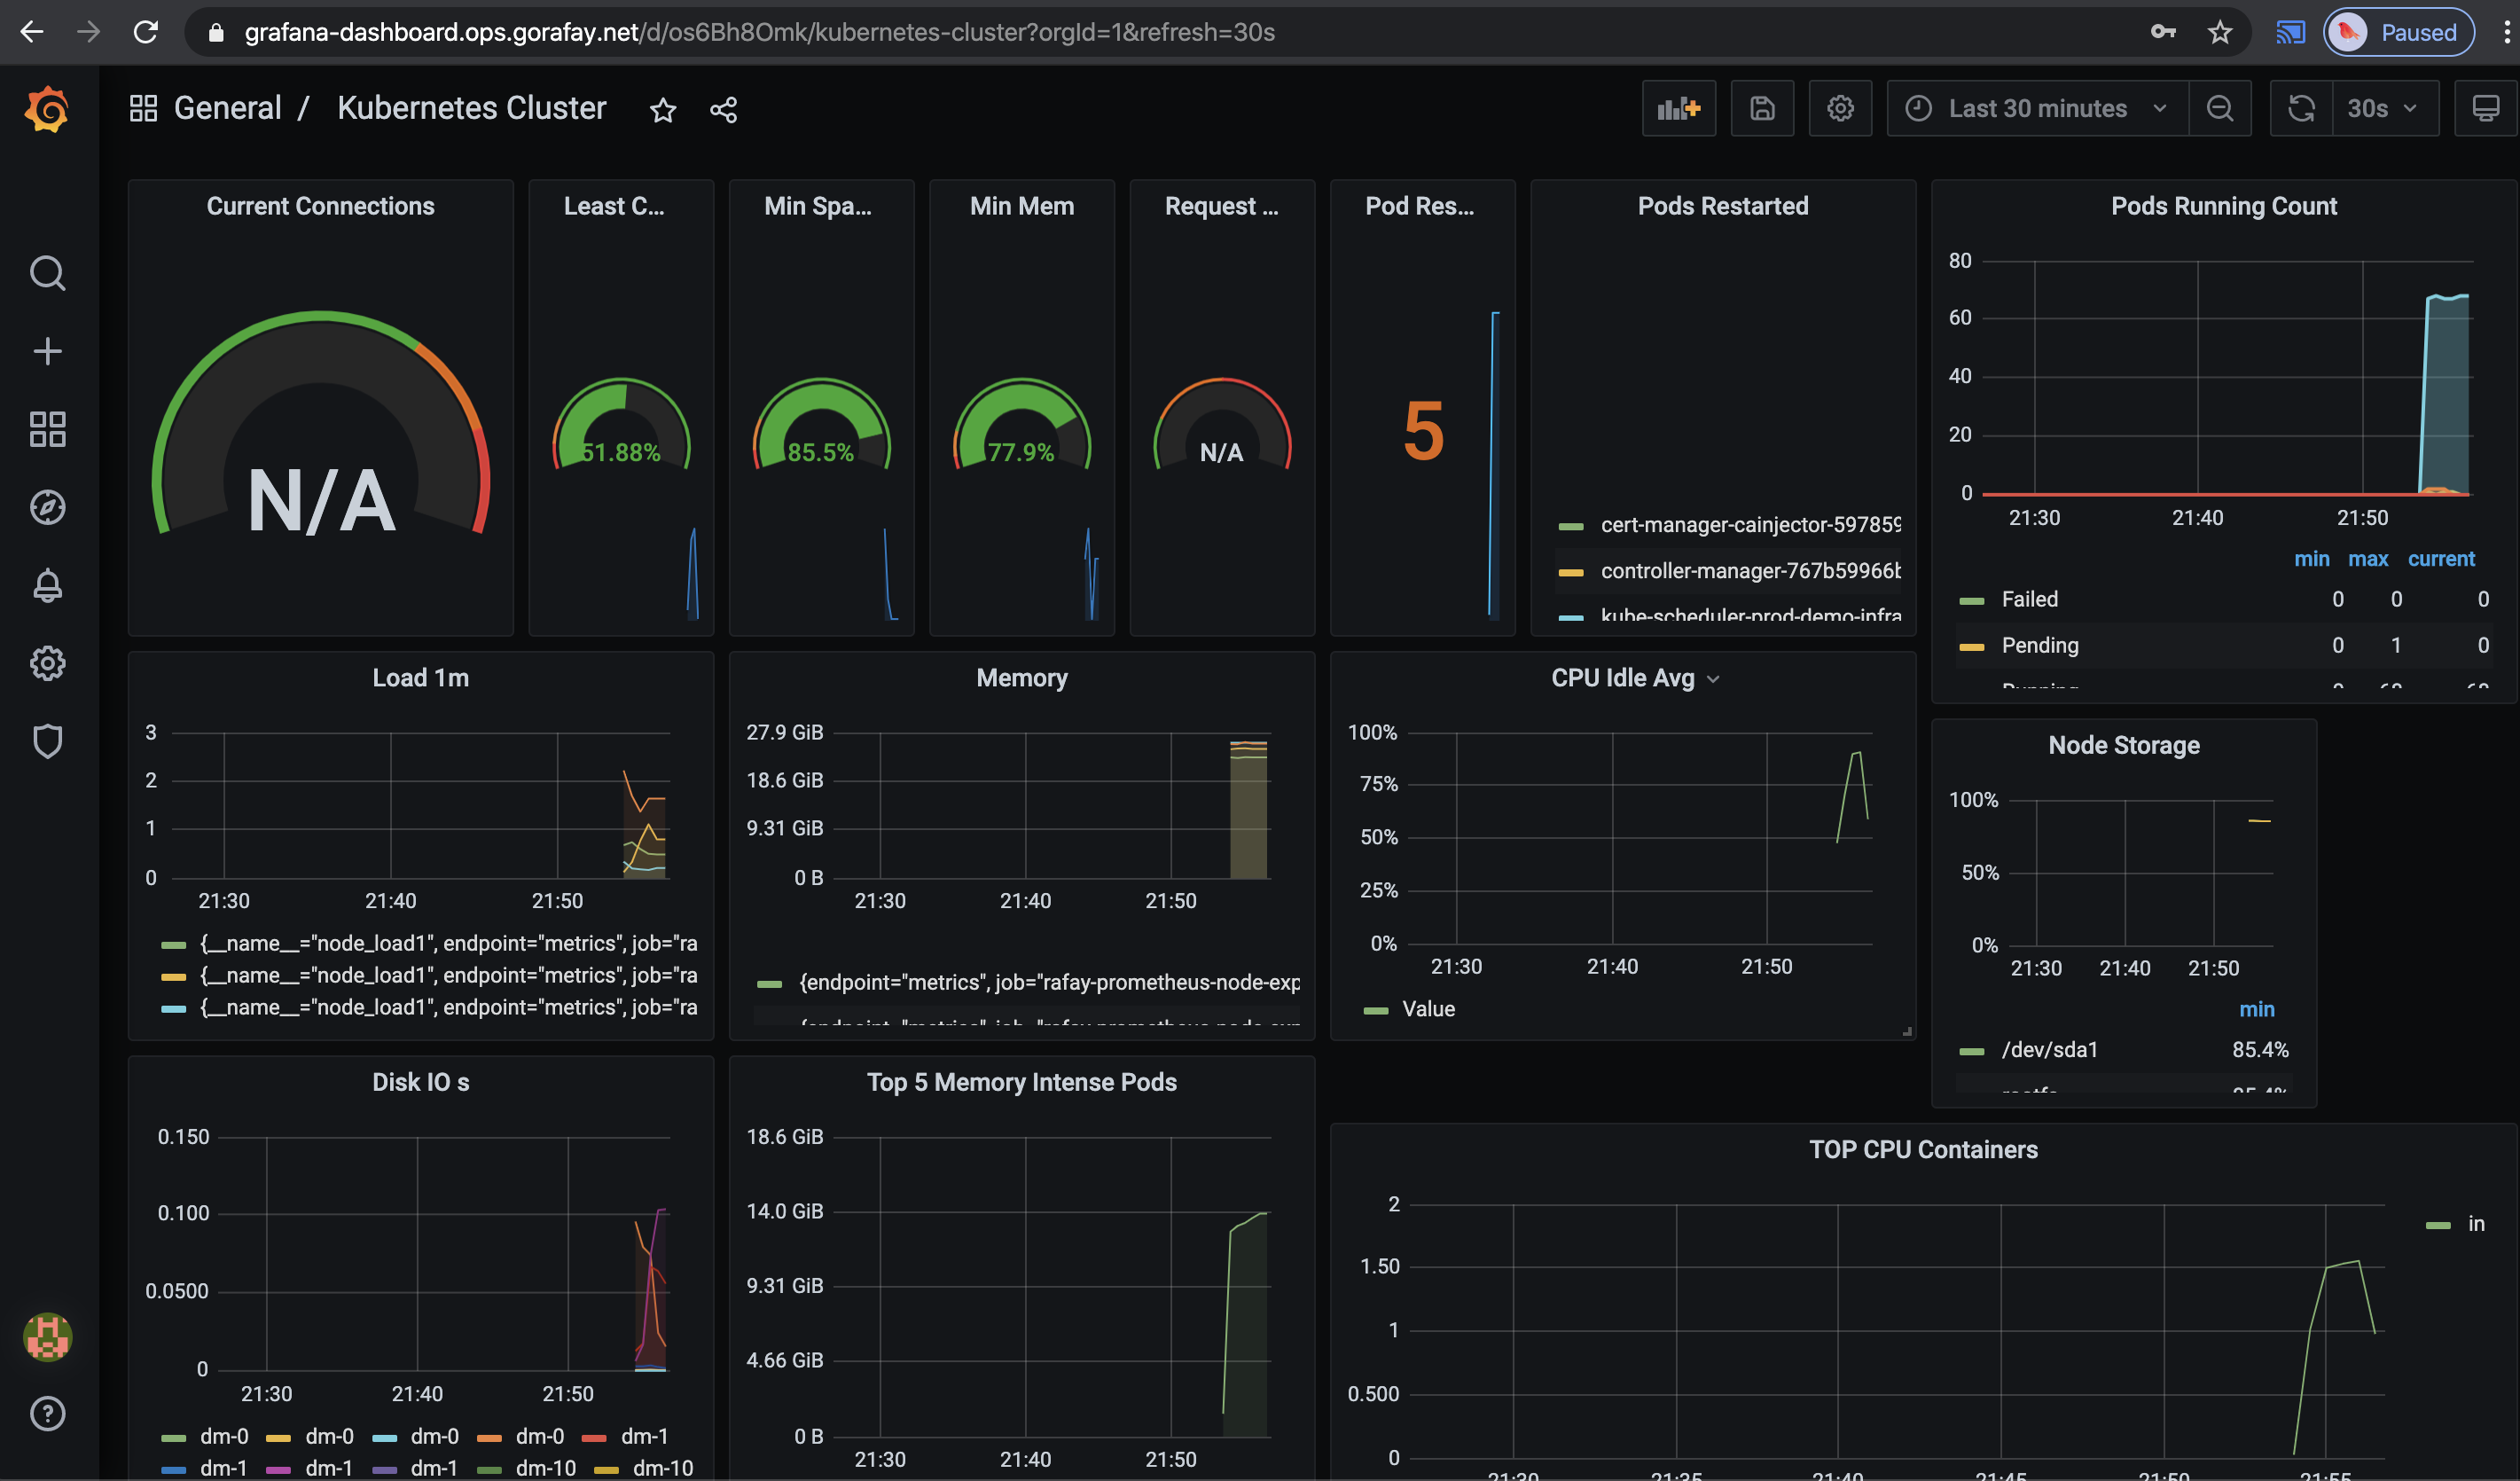
- And you can open any dashboard from the list to get the graphs for your clusters as below example:
Recap
Congratulations! You have successfully created a custom cluster blueprint with the "grafana" addon and applied to a managed cluster and use the Grafana dashboard for your cluster. You can now use this blueprint on as many clusters as you require.