Overview
This is a self paced exercise to explore how you can debug and diagnose issues with workloads using integrated troubleshooting capabilities in the platform. This exercise will focus on learning how developers can leverage the "integrated troubleshooting" capabilities of the platform to debug and diagnose issues with their applications. Learn more about workloads here.
Troubleshooting Capabilities
The platform provides a number of integrated capabilities that can be used by developers to quickly troubleshoot issues with their applications on remote clusters. All they have to do is login into their Org, navigate to the Project and then select the workload in question.
Kubernetes Resources Dashboard
Developers can use the integrated Kubernetes resources dashboard to view the status of resources associated with their workload. Learn more about the integrated Kubernetes Resources Dashboard.
Important
Note that the developer is provided with an pre-filtered view of k8s resources associated with their workload only based on labels that are injected automatically.
Zero Trust Kubectl Access
Authorized users can use the integrated, zero trust kubectl web shell to securely interact with the cluster's API server. Learn More about the Zero Trust Access service.
Metrics
On clusters where the "Visibility & Monitoring" managed add-on is enabled in the cluster blueprint, metrics are automatically scraped and aggregated centrally at the controller in a ""time series database" for 24-hours. This data is made available to the user via intuitive dashboards for the cluster, node, pod and the containers. Learn more about metrics available via the Cluster Dashboard, Node Dashboard, Pod Dashboard and Container Dashboard.
Alerts & Notifications
On clusters where the "Visibility & Monitoring" managed add-on is enabled in the cluster blueprint, the controller automatically generates alerts when issues are observed on managed clusters. Users can be optionally proactively notified via email based notifications when issues occur.
Learn more about Alerts and Notifications
What Will You Do
In each scenario, you will attempt to deploy a misconfigured workload to a remote cluster. You will then use the integrated troubleshooting capabilities to debug and diagnose issues. Specifically, you will troubleshoot the following workload misconfigurations:
- Misconfigured requests/limits i.e. requests cannot be larger than limits
- Misconfigured/missing container image and tag
Prerequisities
Cluster
You have access to an existing managed cluster (provisioned or imported in a Project in an Org). Follow the steps outlined here if you would like to do this on your laptop.
Create Namespace
We will deploy the workloads to a namespace on your cluster. So, let us create it.
- Navigate to the project in your Org where the cluster is located
- Select Infrastructure -> Namespaces
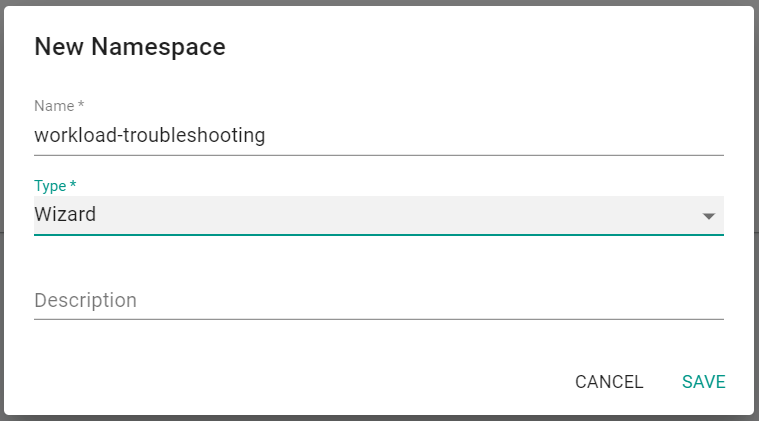
- Click "New Namespace"
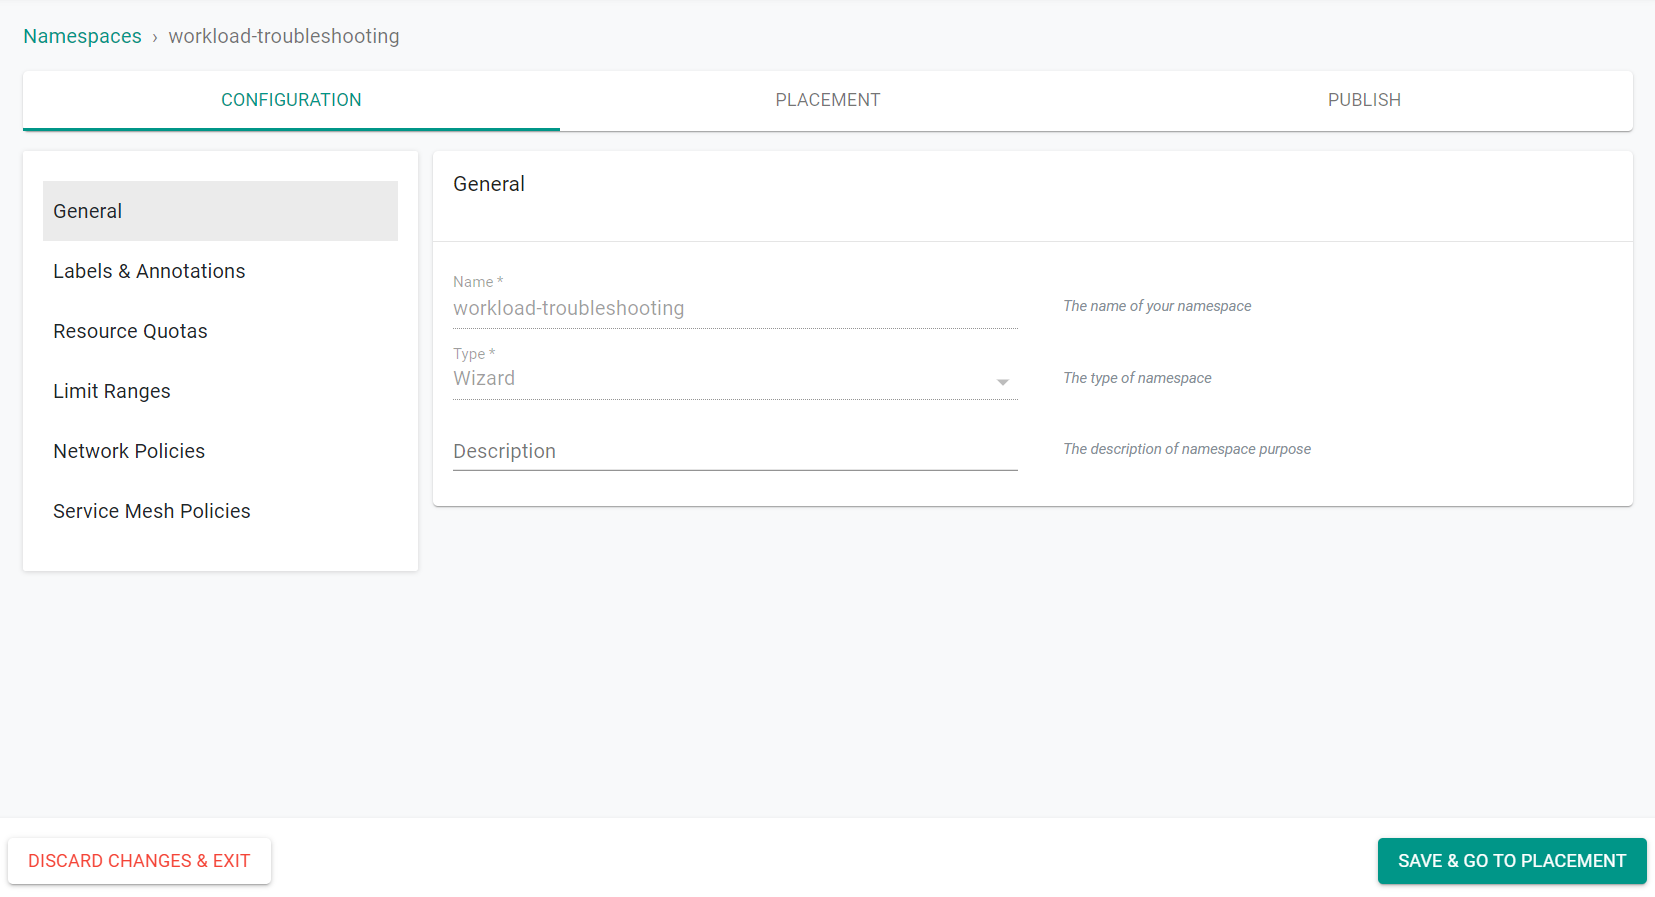
- Enter a Name for the namespace
- Select "Wizard" for the Type
- Click "Save"
- Click "Save & Go To Placement"
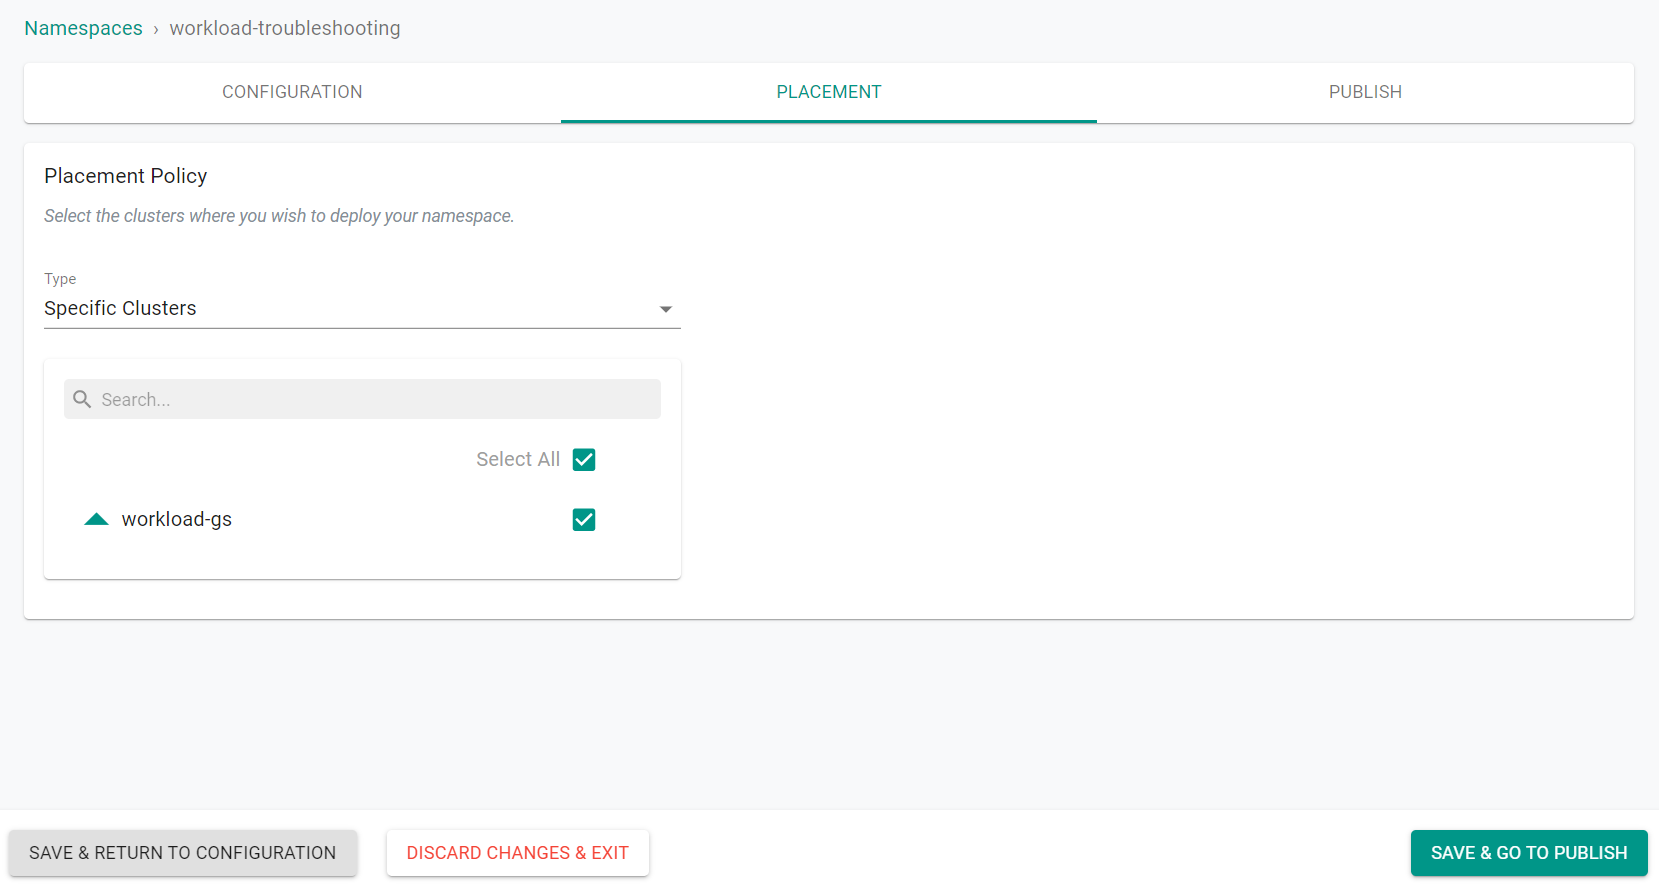
- Select the cluster to create the namespace on
- Click "Save & Go To Publish"
- Click "Publish"
The namespace is now published on the cluster.
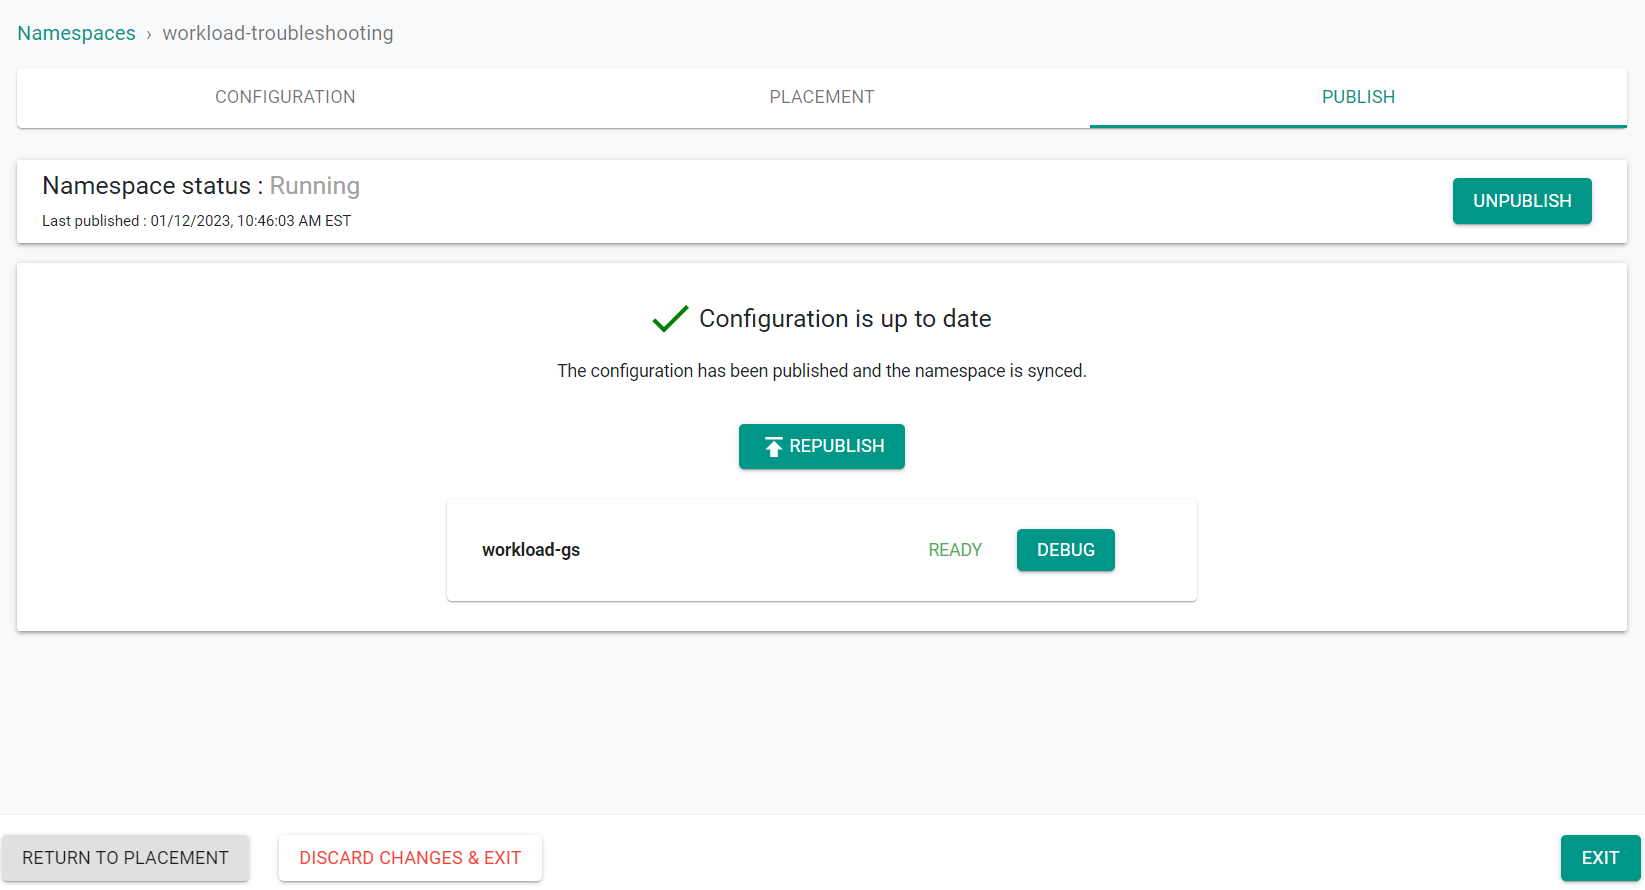
- Click "Exit"