New Relic
Although the Platform provides basic integrated monitoring and visibility capabilities, organizations may prefer to use a best of breed, internal standard such as New Relic for monitoring their Kubernetes clusters.
This recipe describes how customers can standardize the configuration, deployment and lifecycle management of New Relic's Kubernetes Addons across their fleet of clusters. The New Relic Kubernetes Addon needs to be deployed on every Kubernetes cluster so that it can aggregate cluster and applications metrics, events and logs. These are then sent to New Relic's service for centralized monitoring and visibility.
What Will You Do
In this exercise,
- You will create a customized "newrelic" addon using New Relic's "official Helm chart"
- You will use the addon in a custom cluster blueprint
- You will then apply this cluster blueprint to a managed cluster
Important
This recipe describes the steps to create and use a custom cluster blueprint using the Web Console. The entire workflow can also be fully automated and embedded into an automation pipeline.
Assumptions
- You have already provisioned or imported one or more Kubernetes clusters using the controller.
- You have Helm CLI installed locally to download required Helm charts
Step 1: Download Helm Chart
We will be using the New Relic Kubernetes Integration Helm chart from the official repository. In this example, we will be using bundle version v1.7.1 (nri-bundle-1.7.1.tgz) of the New Relic Helm Chart.
- Add the official New Relic helm repo to your Helm CLI if you haven't already added it.
helm repo add newrelic https://helm-charts.newrelic.com
- Download the New Relic Bundle Helm chart. In this example, we will be using v1.7.1 of the chart (filename: nri-bundle-1.7.1.tgz).
helm fetch newrelic/nri-bundle
Step 2: Customize Values
The New Relic Bundle Helm chart comes with a default values.yaml file. We will be customizing the defaults with our own override "values.yaml"
Copy the details below into a file named "nri-bundle-custom-values.yaml".
- Replace the "licenseKey" value with your New Relic License Key.
Note
Reference on how to get New Relic License Key can be found here
## Custom values for New Relic Kubernetes Integration Bundle
## Set Global Config
global:
  ## Change to your New Relic License Key below.
  #
  licenseKey: xxxxxxxxxxxxxxxxxxxxxxxx
  ## Or get New Relic license key from exising secret info below:
  #   customSecretName:
  #   customSecretLicenseKey:
  #
  ## Change the cluster name:
  #
  cluster: demo-eks-cluster

## Set enabled to true to deploy New Relic Infrastructure agent
#
infrastructure:
  enabled: true
## Set enabled to true to deploy New Relic Kubernetes Logging
#
logging:
  enabled: true
## Set enabled to true to deploy New Relic Kubernetes Infrastructure metadata injection webhook
#
webhook:
  enabled: true
## Set enabled to true to deploy New Relic's Prometheus OpenMetrics Integration
#
prometheus:
  enabled: true
## Set enabled to true to deploy kube-state-metrics agent
#
ksm:
  enabled: true
## Set enabled to true to deploy New Relic Events Routers
#
kubeEvents:
  enabled: true
Step 3: Create Addon
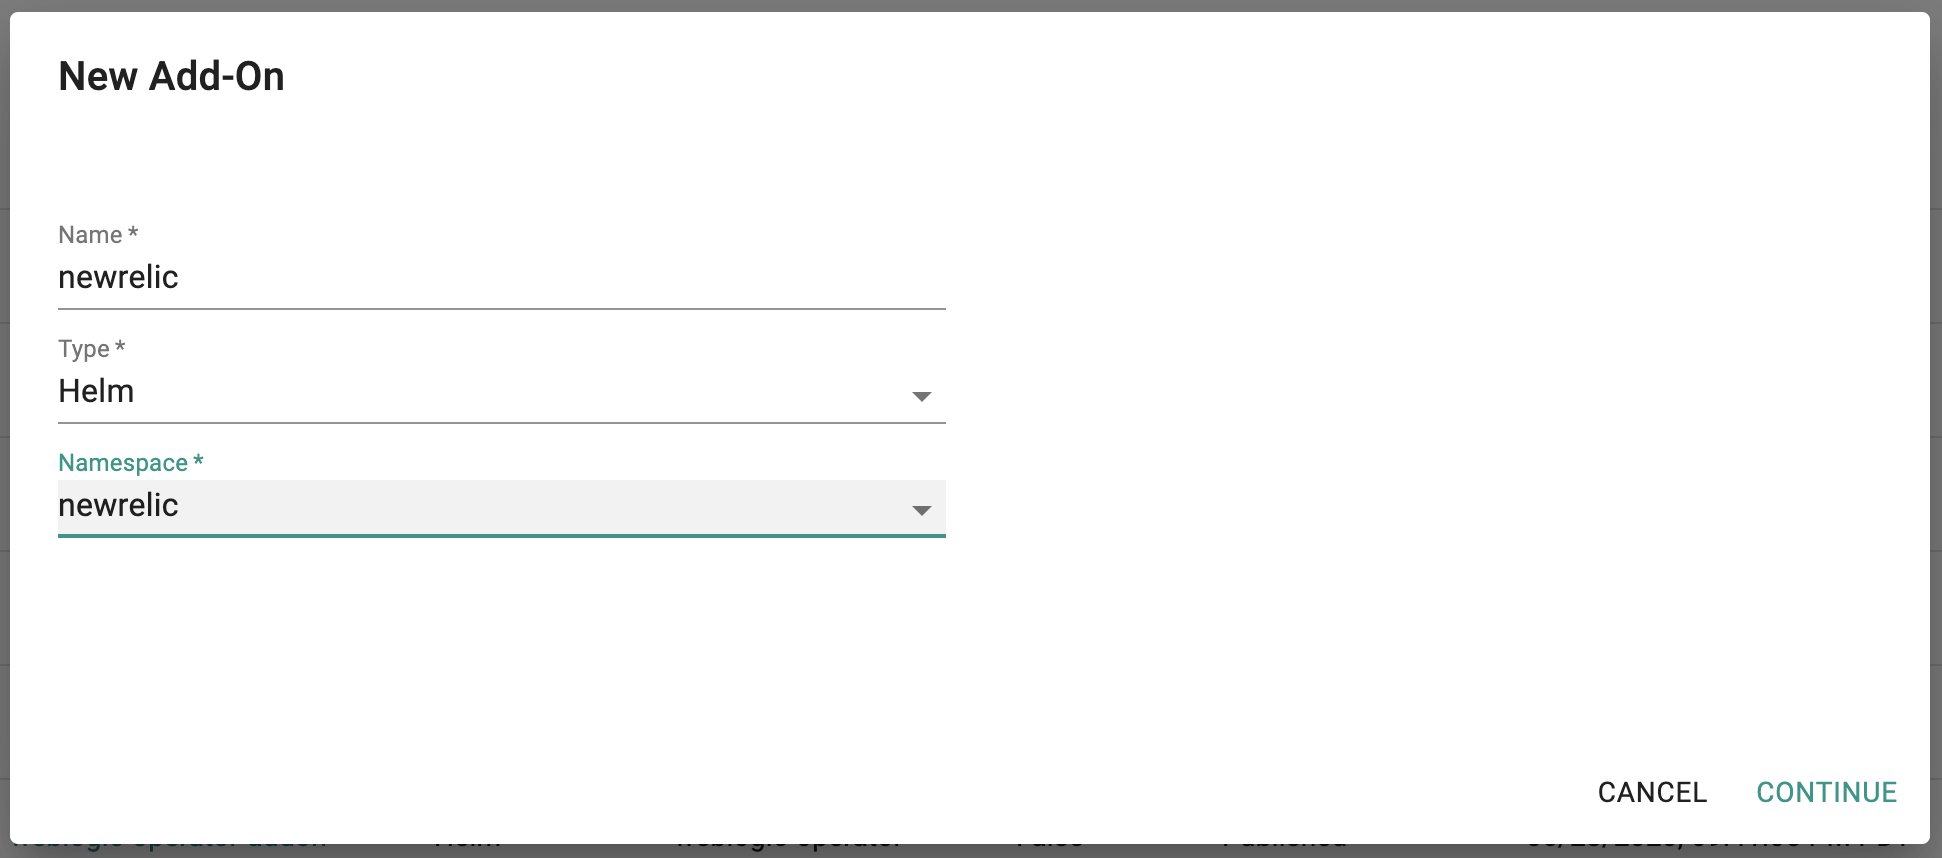
- Login into the Web Console and navigate to your Project as an Org Admin or Infrastructure Admin
- Under Infrastructure, select "Namespaces" and create a new namespace called "newrelic"
- Select "Addons" and "Create" a new Addon called "newrelic"
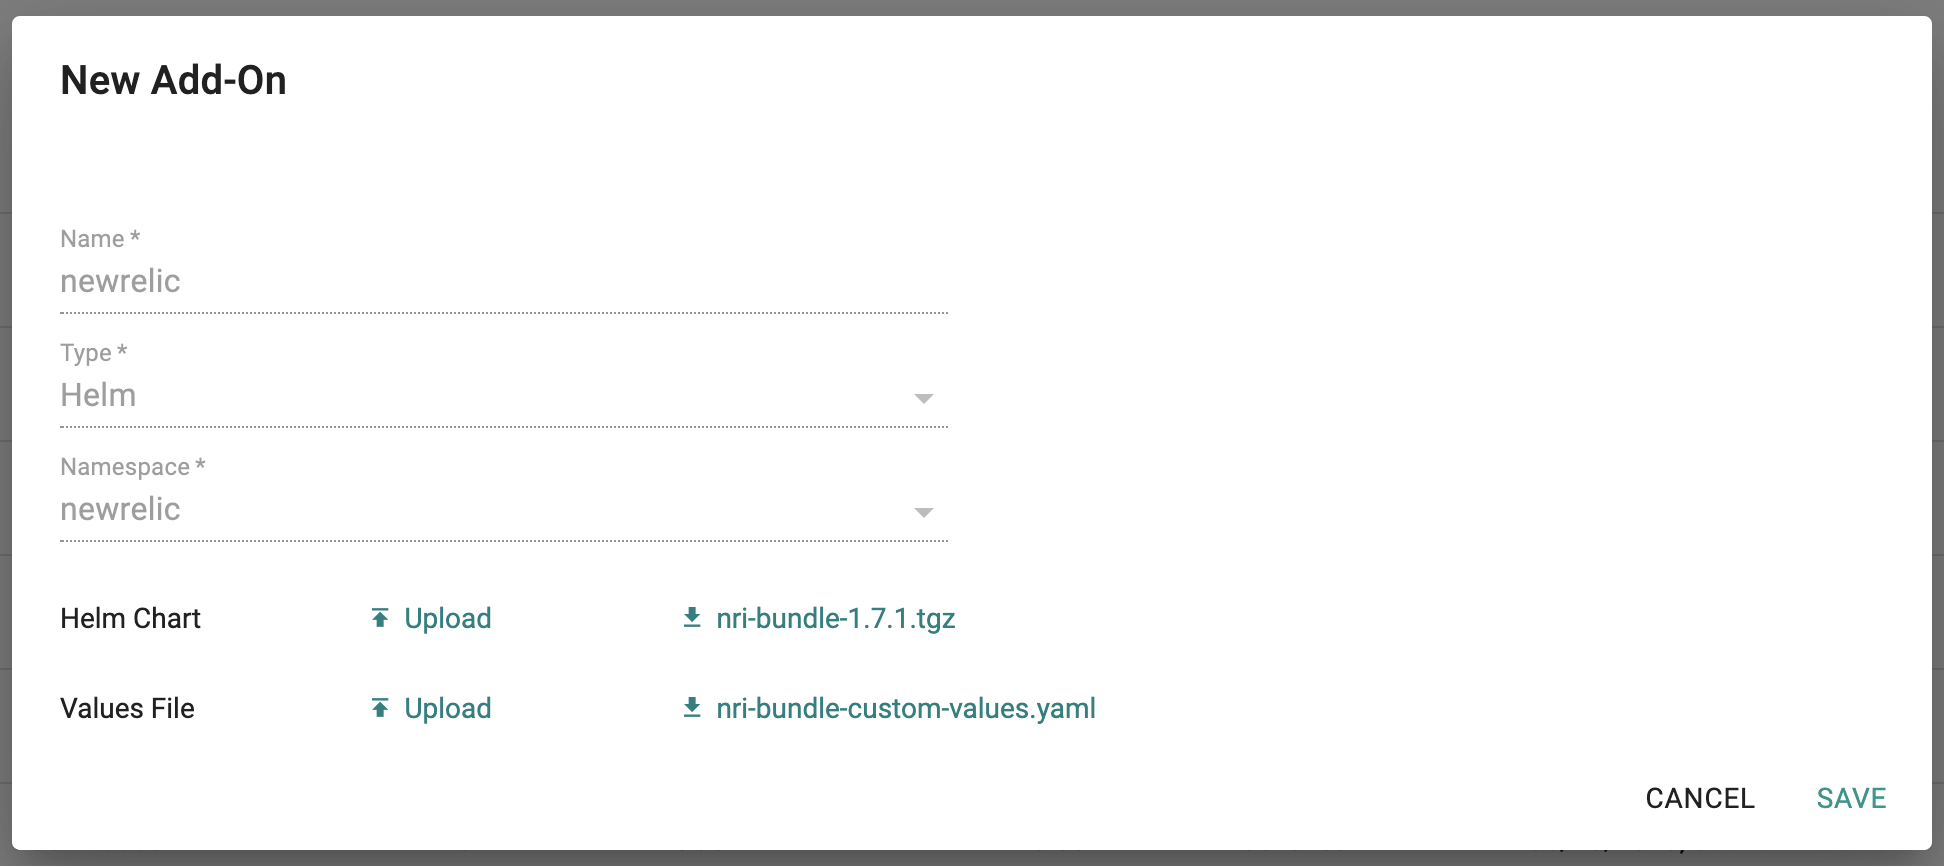
- Ensure that you select "Helm" for type and select the namespace as "newrelic"
- Upload the Helm chart "nri-bundle-1.7.1.tgz" from the previous step, the "nri-bundle-custom-values.yaml" file and Save
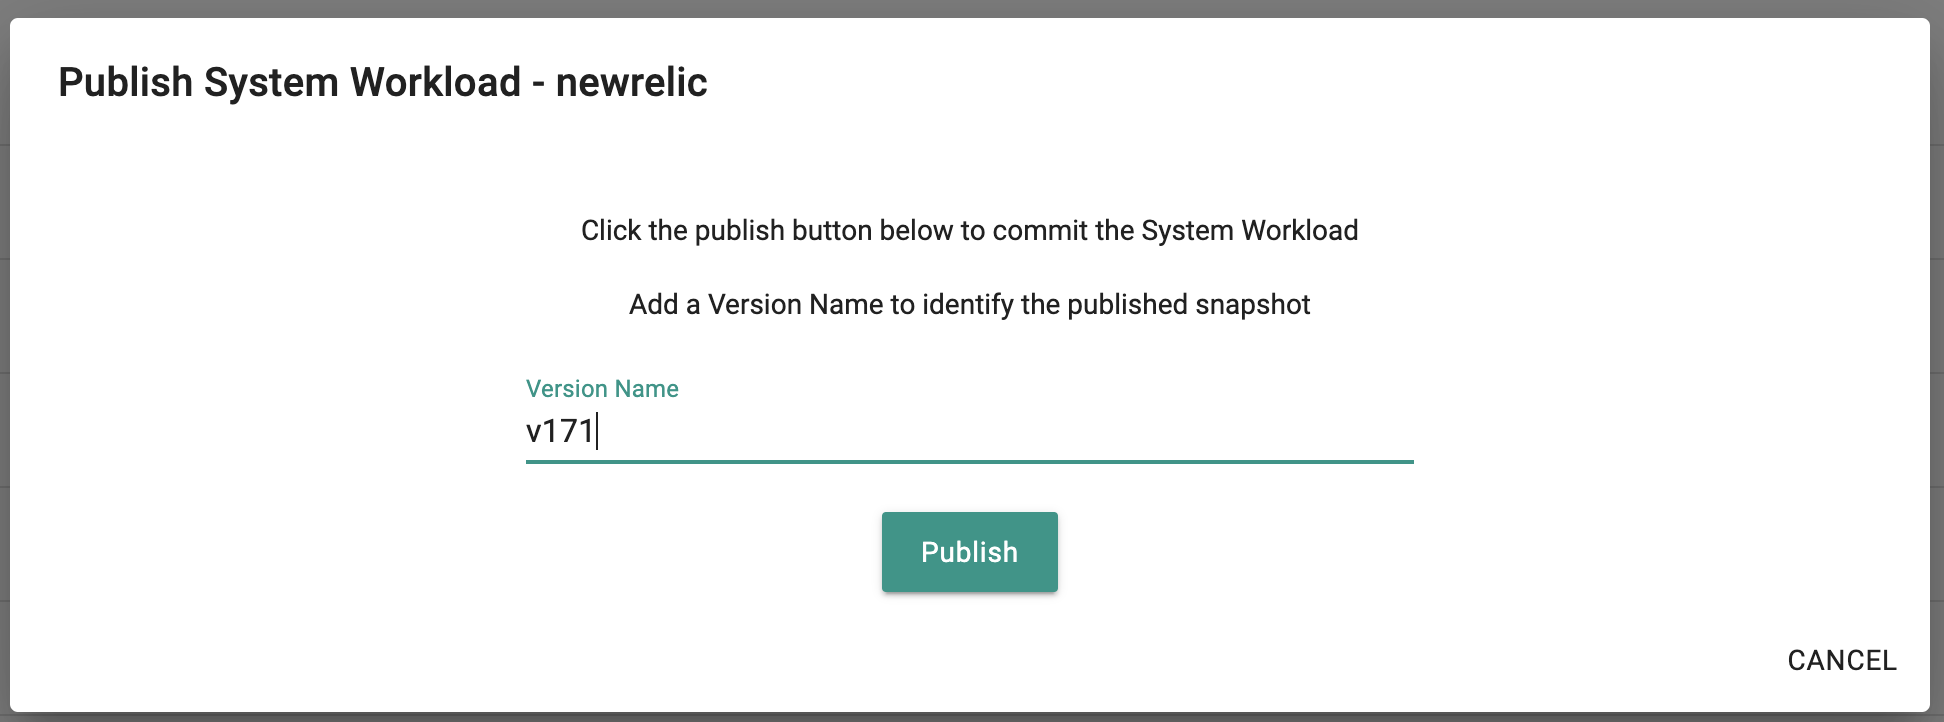
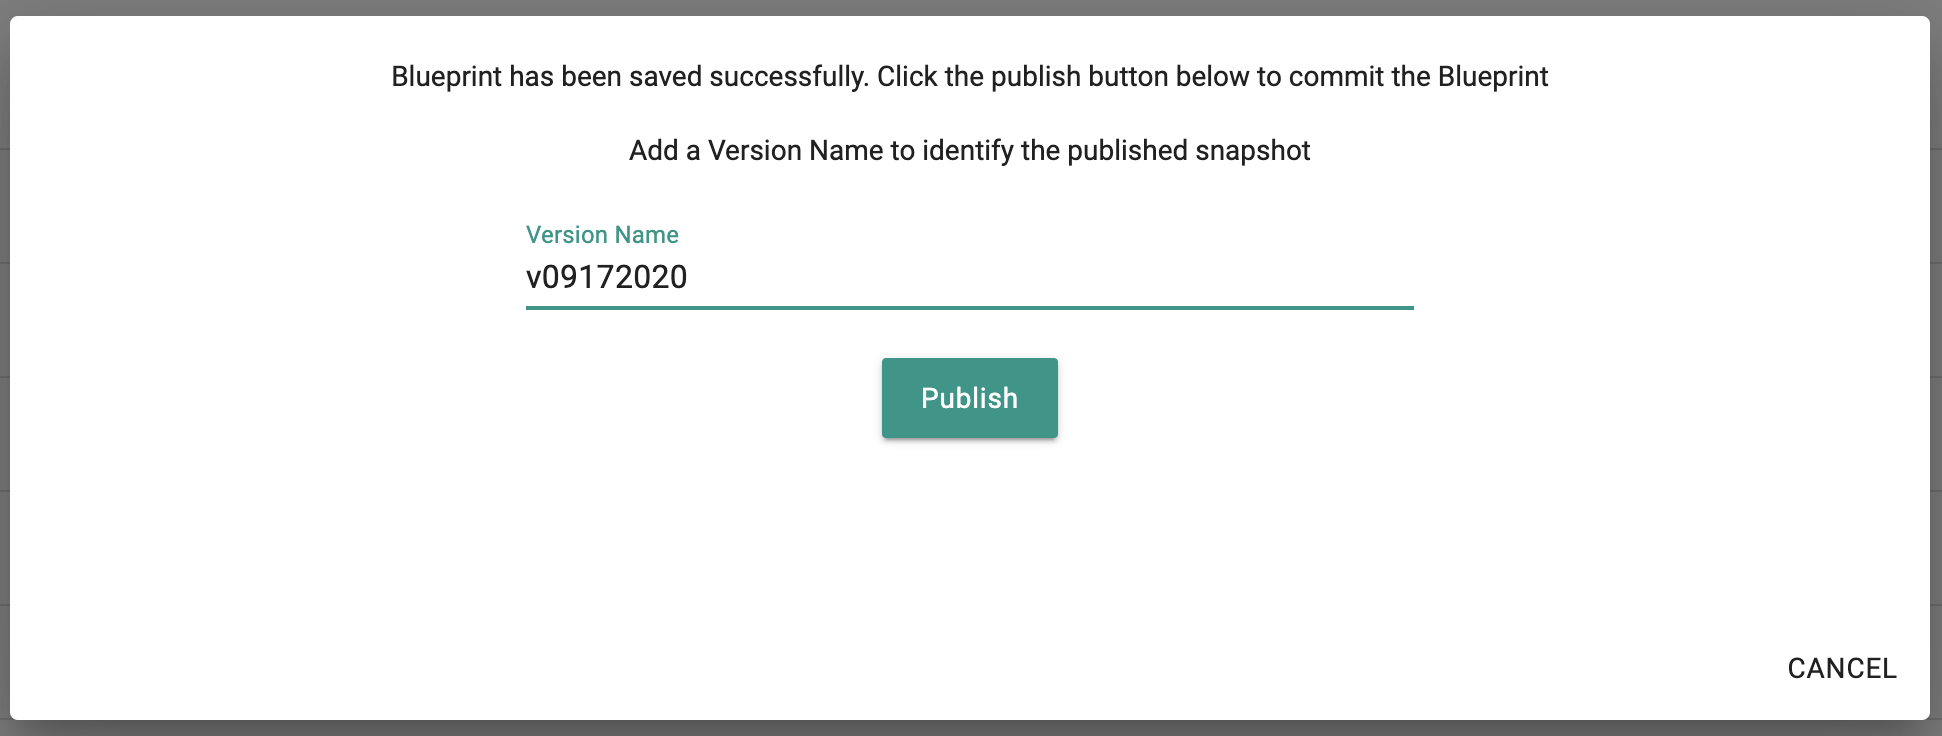
- Once the addon is created, ensure you publish it and optionally provide a version so that it can be tracked.
Step 4: Create Blueprint
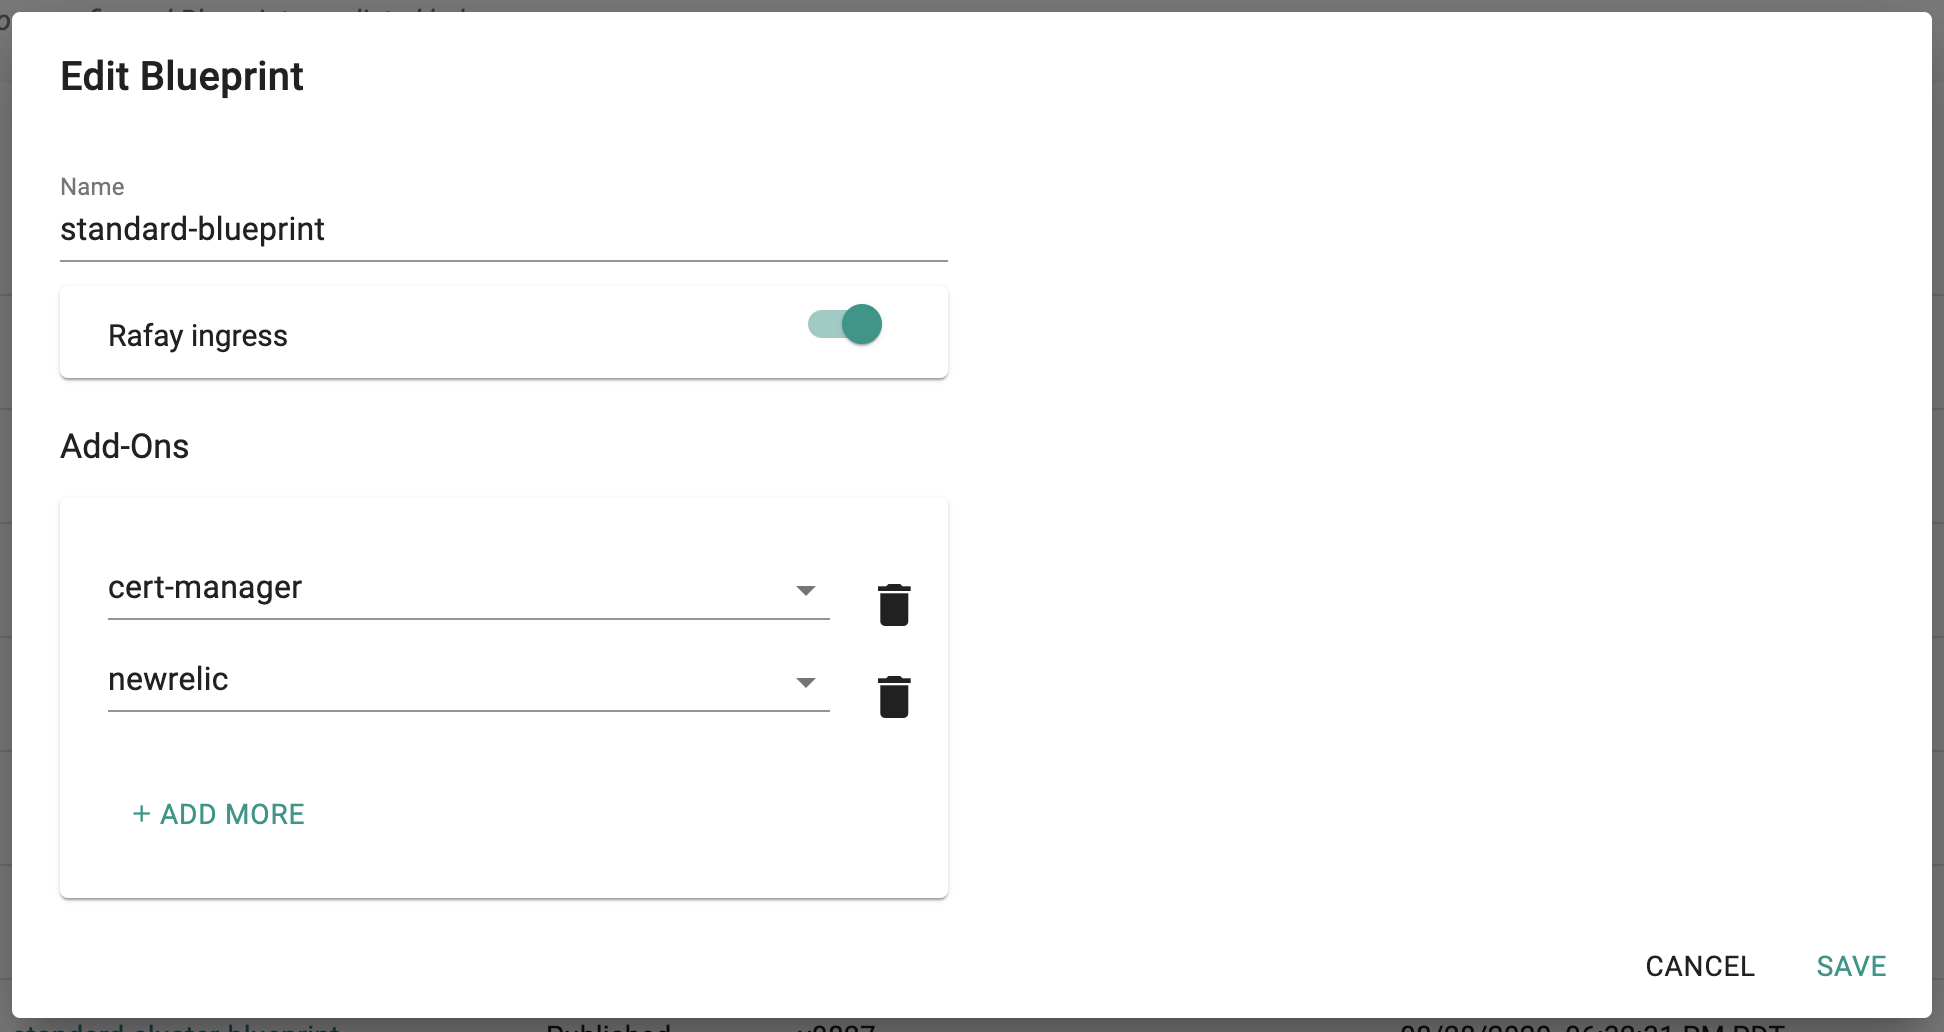
Now, we are ready to assemble a custom cluster blueprint using the newly created New Relic addon. You can add other addons to the same custom blueprint.
- Under Infrastructure, select "Blueprints"
- Create a new blueprint and give it a name such as "standard-blueprint"
- Ensure that you have managed Ingress enabled
- Select the newrelic and other addons as required
- Once the blueprint is created, ensure you publish it and optionally provide a version so that it can be version controlled.
Step 5: Apply Blueprint
Now, we are ready to apply this custom blueprint to a cluster.
- Click on Options for the target Cluster in the Web Console
- Select "Update Blueprint" and select the "standard-blueprint" blueprint we created from the list
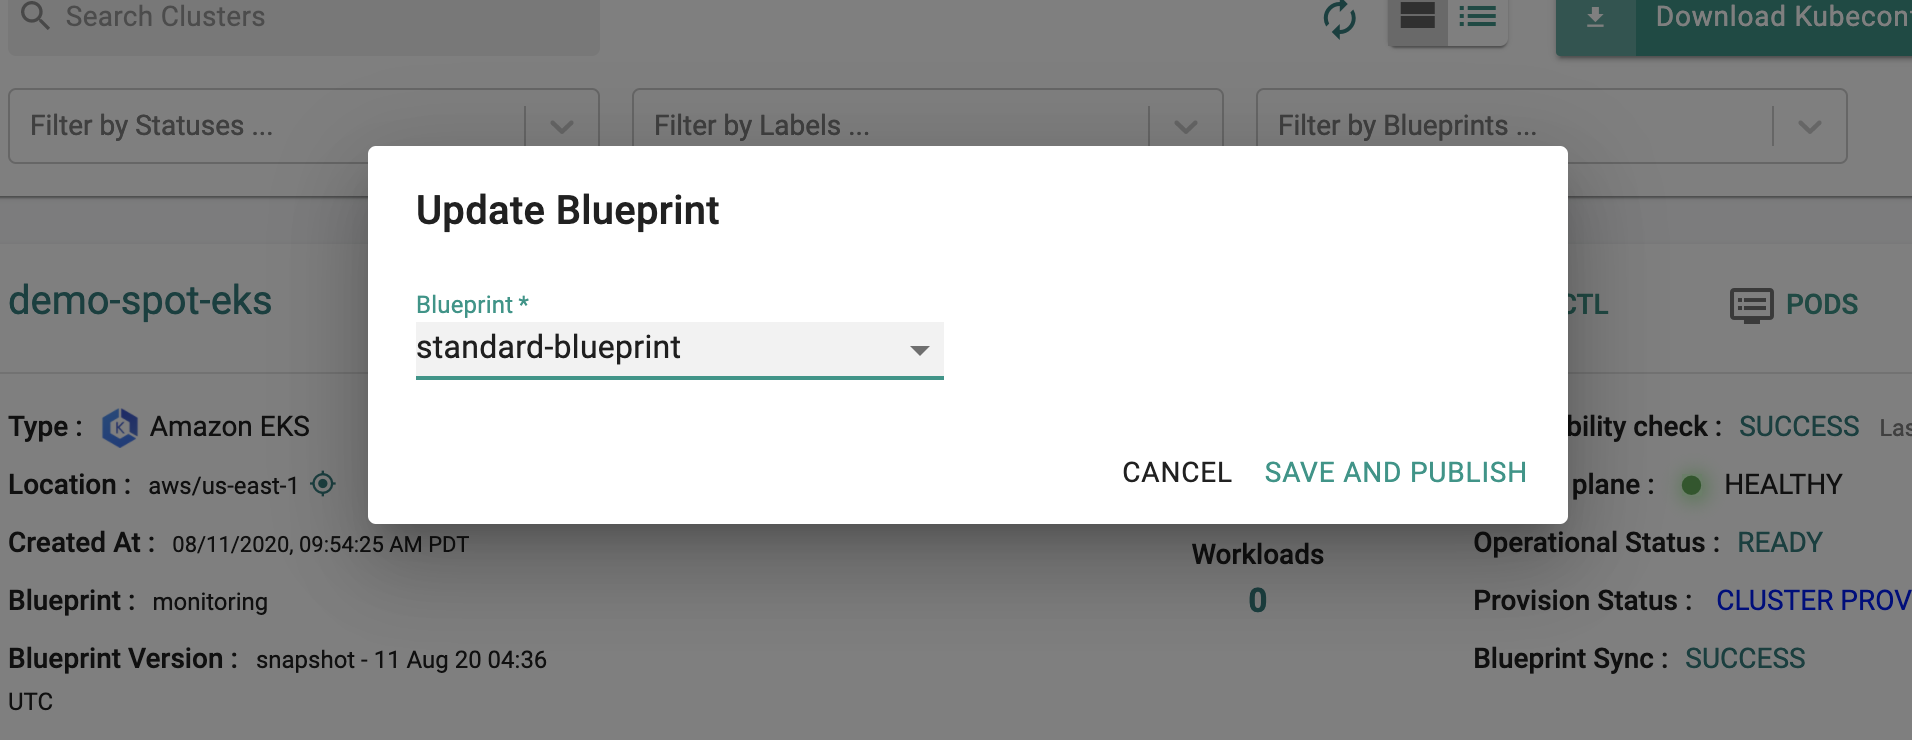
- Click on "Save and Publish".
This will start the deployment of the addons configured in the "standard-blueprint" blueprint to the targeted cluster. The blueprint sync process can take a few minutes. Once complete, the cluster will display the current cluster blueprint details and whether the sync was successful or not.
Step 6: Verify Deployment
Users can optionally verify whether the correct resources have been created on the cluster. Click on the Kubectl button on the cluster to open a virtual terminal
- First, we will verify if the "newrelic" namespace has been created
kubectl get ns newrelic
NAME       STATUS   AGE
newrelic   Active   76m
- Second, we will verify the New Relic Kubernetes Integration daemonsets
kubectl get daemonsets -n newrelic
NAME                                    DESIRED   CURRENT   READY   UP-TO-DATE   AVAILABLE   NODE SELECTOR   AGE
newrelic-v171-newrelic-infrastructure   2         2         2       2            2           <none>          77m
newrelic-v171-newrelic-logging          2         2         2       2            2           <none>          77m
- Then, we will verify the New Relic Kubernetes Integration deployments
kubectl get deploy -n newrelic
NAME                                   READY   UP-TO-DATE   AVAILABLE   AGE
newrelic-v171-kube-state-metrics       1/1     1            1           77m
newrelic-v171-nri-kube-events          1/1     1            1           77m
newrelic-v171-nri-metadata-injection   1/1     1            1           77m
newrelic-v171-nri-prometheus           1/1     1            1           77m
- Next, we will verify the pods in the "newrelic" namespace. You should see something like the example below.
kubectl get pod -n newrelic
NAME                                                    READY   STATUS      RESTARTS   AGE
newrelic-v171-kube-state-metrics-6df45994d8-fz6h6       1/1     Running     0          76m
newrelic-v171-newrelic-infrastructure-k67v7             1/1     Running     0          76m
newrelic-v171-newrelic-infrastructure-sjmt4             1/1     Running     0          76m
newrelic-v171-newrelic-logging-j6d9c                    1/1     Running     0          76m
newrelic-v171-newrelic-logging-s4zkd                    1/1     Running     3          76m
newrelic-v171-nri-kube-events-74f446c946-zrtst          2/2     Running     0          76m
newrelic-v171-nri-metadata-injection-679f86cd6c-nzp6k   1/1     Running     0          76m
newrelic-v171-nri-metadata-injection-job-dp79s          0/1     Completed   0          76m
newrelic-v171-nri-prometheus-579ddfd5b4-7hdph           1/1     Running     0          76m
- Then, we will verify the newrelic-infrastructure logs and ensure the agent posted payload successfully to New Relic website.
kubectl logs daemonset/newrelic-v171-newrelic-infrastructure -n newrelic --tail=50
Found 2 pods, using pod/newrelic-v171-newrelic-infrastructure-sjmt4
time="2020-09-18T04:40:52Z" level=info msg="runtime configuration" agentUser=root component="New Relic Infrastructure Agent" executablePath= maxProcs=1 pluginDir="[/etc/newrelic-infra/integrations.d /var/db/newrelic-infra/integrations.d]"
time="2020-09-18T04:40:53Z" level=info msg="Checking network connectivity..." component=AgentService service=newrelic-infra
time="2020-09-18T04:40:53Z" level=info msg=Initializing component=AgentService elapsedTime=341.281776ms service=newrelic-infra version=1.12.3
time="2020-09-18T04:40:53Z" level=info msg="New Relic infrastructure agent is running." component=AgentService elapsedTime=558.561255ms service=newrelic-infra
time="2020-09-18T04:40:53Z" level=info msg="Starting up agent..." component=Agent
time="2020-09-18T04:40:53Z" level=warning msg="failed to connect to DBus. make sure systemd is present." component=NotificationHandler
time="2020-09-18T04:40:53Z" level=warning msg="failed to init shutdown monitor" component=NotificationHandler error="no systemd found"
time="2020-09-18T04:40:53Z" level=info msg="Agent plugin" plugin=metadata/attributes
time="2020-09-18T04:40:53Z" level=info msg="Agent plugin" plugin=metadata/system
time="2020-09-18T04:40:53Z" level=info msg="Agent plugin" plugin=metadata/host_aliases
time="2020-09-18T04:40:53Z" level=info msg="Agent plugin" plugin=metadata/agent_config
time="2020-09-18T04:40:53Z" level=info msg="Agent plugin" plugin=metadata/proxy_config
time="2020-09-18T04:40:53Z" level=info msg="Integration info" arguments="map[]" command=metrics commandLine="[./bin/nri-kubernetes --metrics]" env-vars="map[CLUSTER_NAME:demo-spot-eks ETCD_TLS_SECRET_NAMESPACE:<HIDDEN> KUBERNETES_SERVICE_HOST:10.0.0.1 KUBERNETES_SERVICE_PORT:443 NRK8S_NODE_NAME:aks-agentpool-29632813-vmss000001 PATH:/usr/local/sbin:/usr/local/bin:/usr/sbin:/usr/bin:/sbin:/bin VERBOSE:0]" instance=nri-kubernetes integration=com.newrelic.kubernetes interval=15 labels="map[]" os=linux prefix=integration/com.newrelic.kubernetes protocolVersion=2 workingDir=/var/db/newrelic-infra/newrelic-integrations
time="2020-09-18T04:40:53Z" level=info msg="Integration health check starting" instance=nri-kubernetes integration=com.newrelic.kubernetes prefix=integration/com.newrelic.kubernetes working-dir=/var/db/newrelic-infra/newrelic-integrations
time="2020-09-18T04:40:53Z" level=info msg="connect got id" agent-guid=Mjg3NzY5M3xJTkZSQXxOQXwzMDQyNDc2Mzk0NTE0Njk5NTM agent-id=304247639451469953 component=IdentityConnectService
time="2020-09-18T04:40:56Z" level=info msg="Integration health check finished with success" instance=nri-kubernetes integration=com.newrelic.kubernetes prefix=integration/com.newrelic.kubernetes working-dir=/var/db/newrelic-infra/newrelic-integrations
- Then, we will verify the newrelic-logging logs and ensure the agent posted payload successfully to New Relic website.
kubectl logs daemonset/newrelic-v171-newrelic-logging -n newrelic --tail=20
Found 2 pods, using pod/newrelic-v171-newrelic-logging-rbpjz
Fluent Bit v1.0.3
Copyright (C) Treasure Data

[2020/09/18 04:00:59] [ info] [storage] initializing...
[2020/09/18 04:00:59] [ info] [storage] in-memory
[2020/09/18 04:00:59] [ info] [storage] normal synchronization mode, checksum disabled
[2020/09/18 04:00:59] [ info] [engine] started (pid=1)
[2020/09/18 04:01:00] [ warn] [filter_kube] merge_json_log is deprecated, enabling 'merge_log' option instead
[2020/09/18 04:01:00] [ info] [filter_kube] https=1 host=kubernetes.default.svc.cluster.local port=443
[2020/09/18 04:01:00] [ info] [filter_kube] local POD info OK
[2020/09/18 04:01:00] [ info] [filter_kube] testing connectivity with API server...
[2020/09/18 04:01:00] [ warn] [filter_kube] could not get meta for POD node-jke1xgm-172-16-7-21-demo-azure-onprem
[2020/09/18 04:01:00] [ info] [http_server] listen iface=0.0.0.0 tcp_port=2020
Step 7: Verify Data Collected
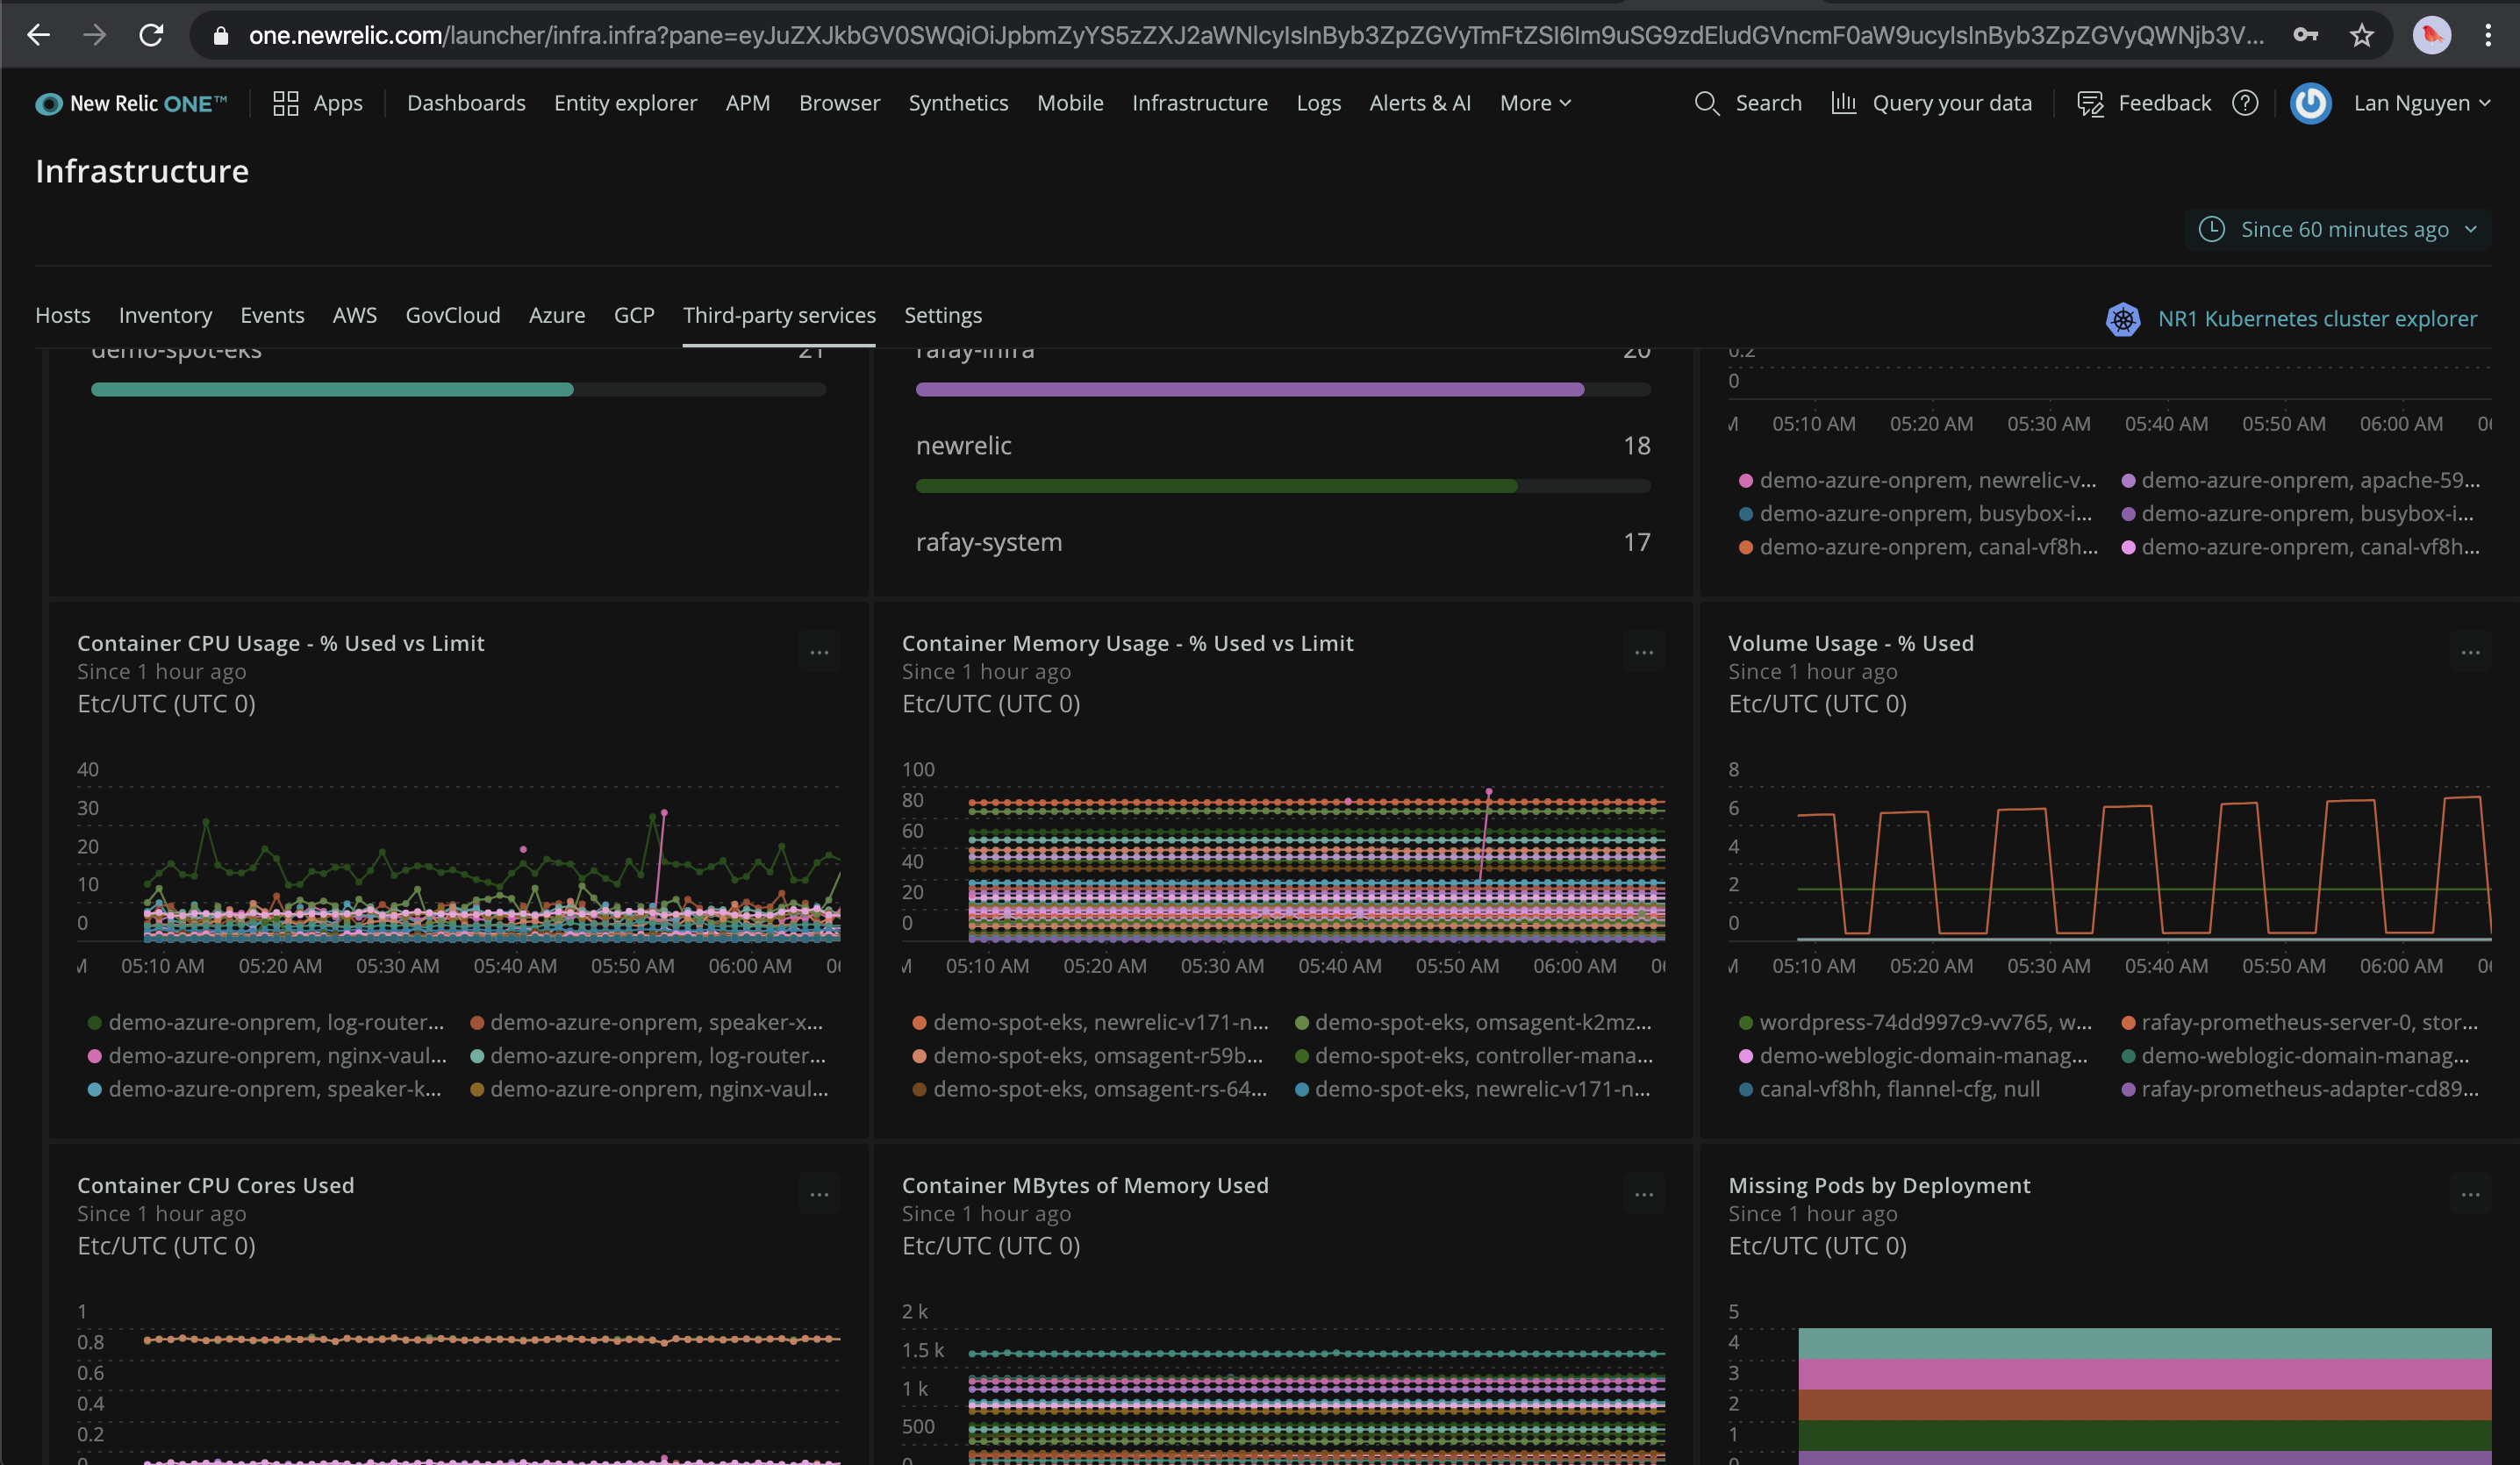
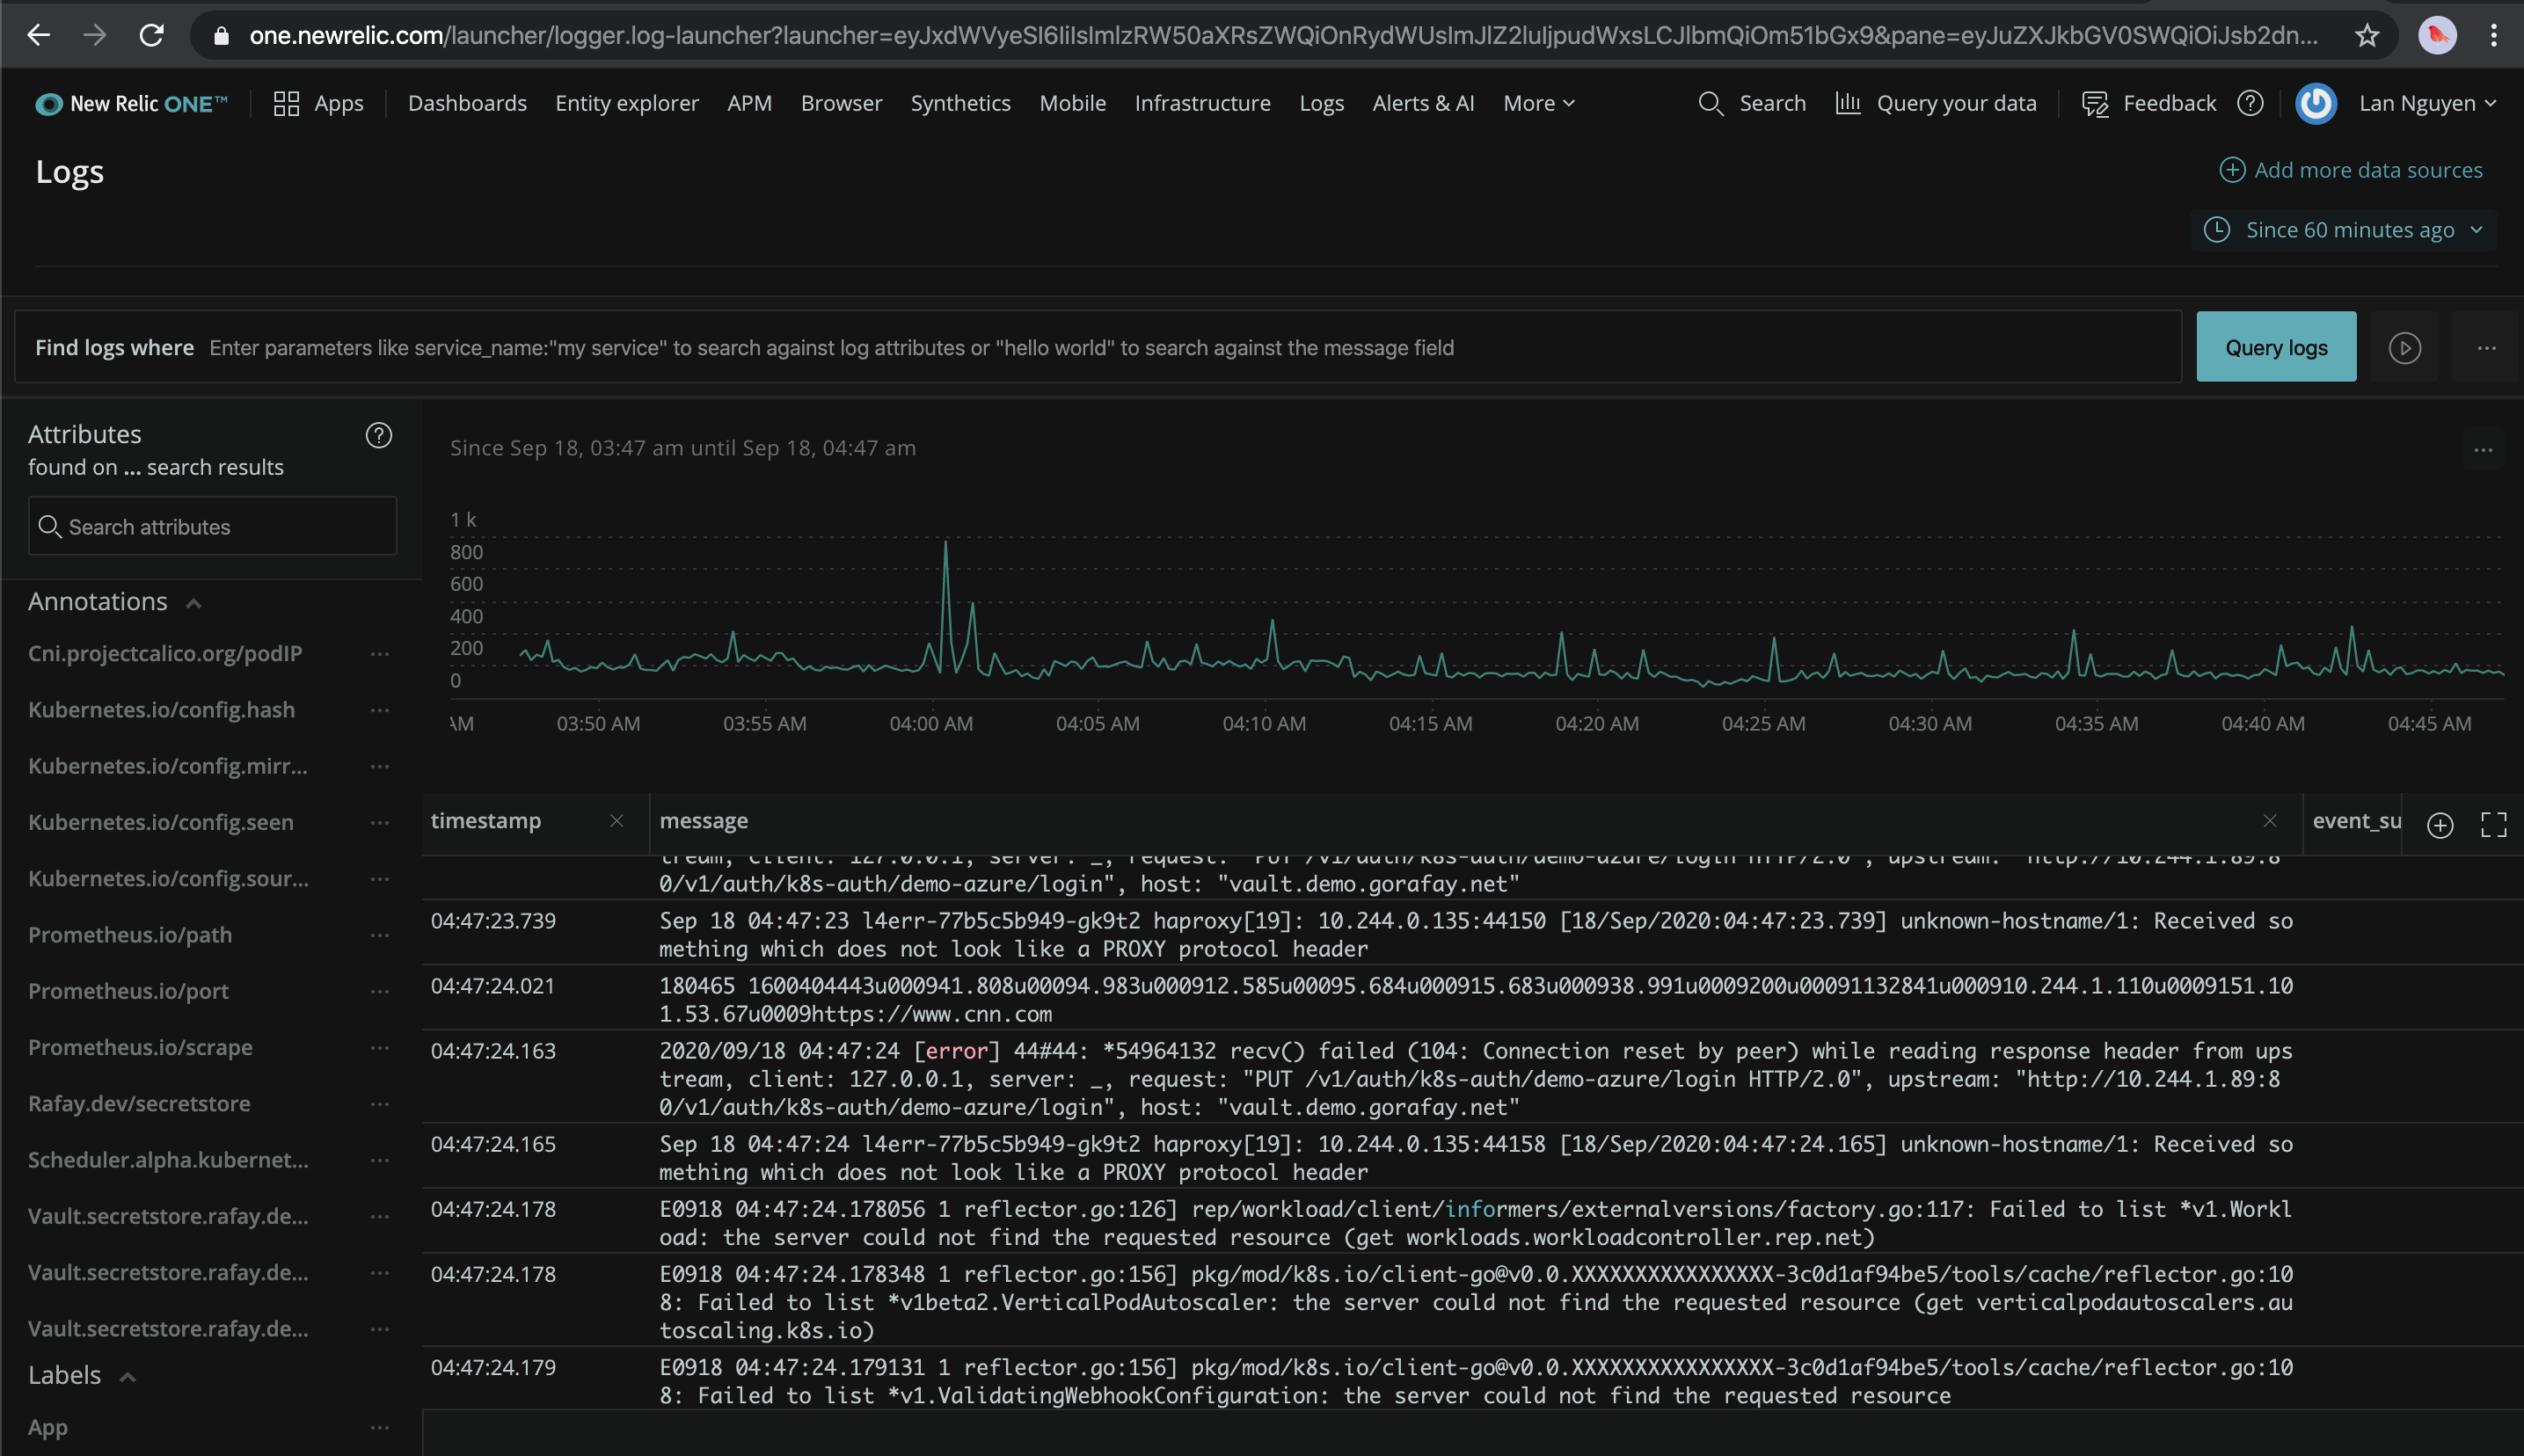
In order to view the collected metrics, events, logs, ... login to your New Relic account and check the Infrastructure and Logs.
- Shown below is an illustrative example of the Infrastructure Kubernetes Dashboard built from the metrics collected by the deployed New Relic Kubernetes Integration in your clusters.
- And below is another illustrative example of logs from the Kubernetes clusters collected by the deployed New Relic Kubernetes Integration in your clusters.
Recap
Congratulations! You have successfully created a custom cluster blueprint with the "newrelic" addon and applied to a managed cluster. You can now use this blueprint on as many clusters as you require.