Enable Logging
Overview
When running multiple applications in a Kubernetes cluster, a centralized, cluster-level logging stack can help to quickly sort and analyze the data logs generated by the pods. A popular solution is the Elasticsearch, Fluentbit, and Kibana stack (EFK).
- Elasticsearch is a distributed, free and open search and analytics engine for all types of data, including textual, numerical, geospatial, structured, and unstructured. It is used for indexing and searching through large volumes of log data.
- Kibana is a proprietary data visualization frontend and dashboard software for Elasticsearch. Kibana helps in exploring the log data through a web interface.
- Fluent Bit is a lightweight log processor and forwarder that allows you to collect data and logs from different sources, unify them, and send them to multiple destinations.
Prerequisites
- A Kubernetes cluster running the Kong controller. This cluster must be imported into the Console. Follow these import steps to import a cluster.
- An Elastic Cloud account or an existing ELK stack deployed. See the Elastic website for more information.
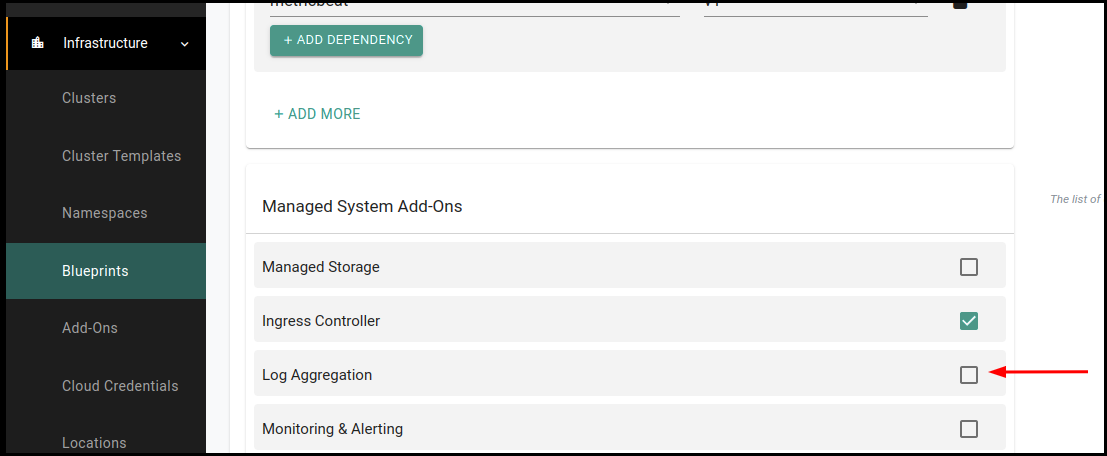
- Make sure the Ingress Controller and Log Aggregation are deselected in the default blueprint and that the update default blueprint is applied to the cluster. This removes the FluentD setup, which will be replaced by Fluent Bit.
Deploy as Default Blueprint
Create a Fluent Bit Namespace
For the deployment of Fluent Bit on the Kubernetes cluster, create a namespace for Fluent Bit.
- In the Console, select the project for Fluent Bit.
- Select Infrastructure > Namespace.
- Click New Namespace.
-
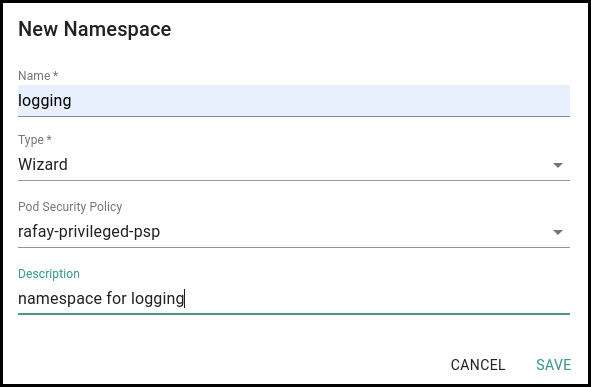
Use the following settings.
- Name: logging
- Type: Wizard
- Pod Security Policy: rafay-privileged-psp
- Description: namespace for logging
-
Click Save.
- Click SAVE AND GO TO PLACEMENT.
- Click SAVE AND GO TO PUBLISH.
- Select the cluster to deploy the namespace to.
- Click SAVE AND GO TO PUBLISH.
- Click PUBLISH. The namespace is published to the cluster.
Add Fluent Bit Helm repository
- In the Console, select the project for Fluent Bit.
- Select Integration > Repository.
- Click New Repository.
-
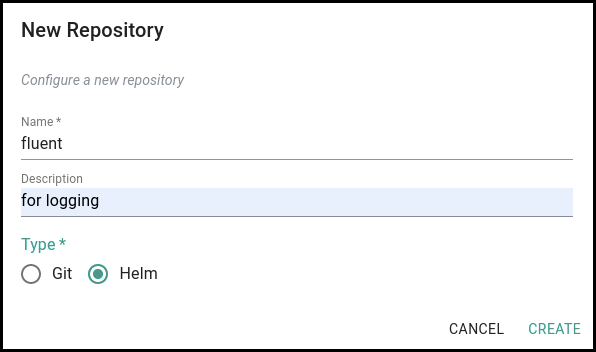
Use the following settings.
- Name: fluent
- Description: for logging
- Type: Helm
-
Click Create.
-
For Endpoint, enter
https://fluent.github.io/helm-charts.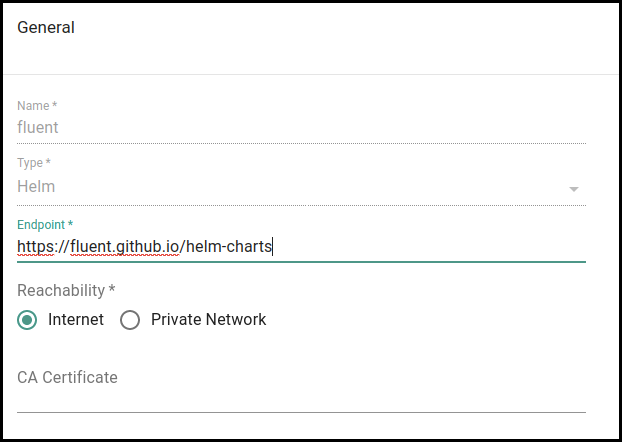
-
Click Save.
Add Fluent Bit as Add-On
- In the Console, select the project for Fluent Bit.
- Select Infrastructure > Add-Ons.
- Select New Add-On > Create New Add-On.
-
Use the following settings.
- Name: fluent-bit
- Type: Helm 3
- Artifact Sync: Pull files from repository
- Repository Type: Helm
- Namespace: logging
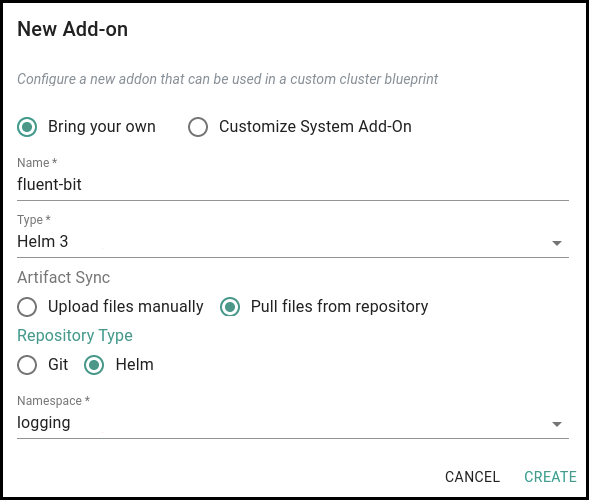
-
Click Create.
-
Use the following settings.
- Version Name: v1
- Description: for logging
- Repository: fluent
- Chart Name: fluent-bit
- Chart Version: 0.19.20
- Values File(s): Upload
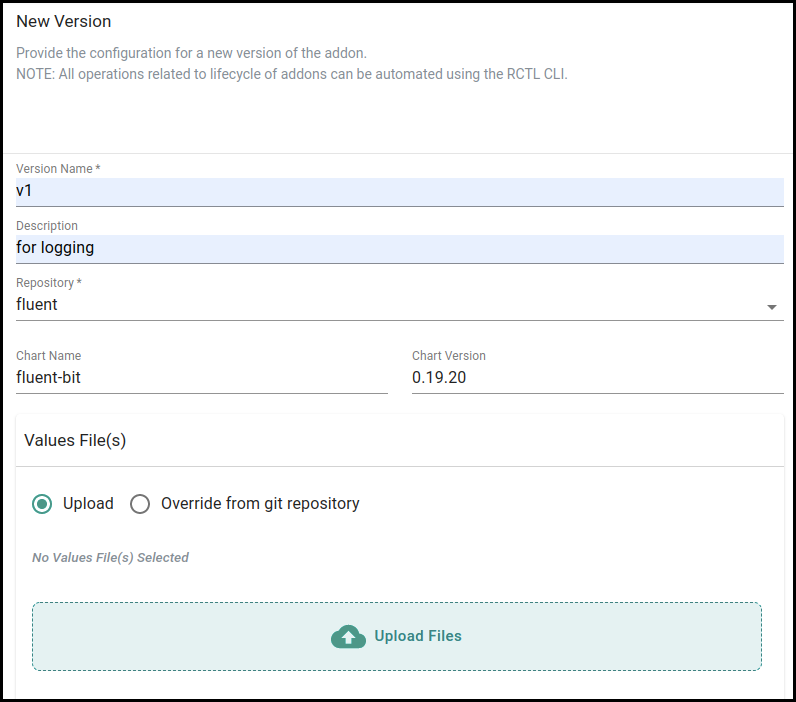
-
Click Save Changes.
Create a Values YAML File
For any customization of Fluent Bit to be deployed, a custom values YAML file is needed. The YAML file allows managing the index name and which namespace logs to view.
In the values.yaml file, the logs are fetched from two namespaces, kong and kube-system, and from two different indexes. Change the Input section as needed. Add or remove namespaces as needed.
Note
Adding or removing from the Input section requires making changes to the Filter and Output sections accordingly.
In the Output section, the Logstash_Prefix is used to create the index name. The value used will display in Kibana.
values.yaml
config:
  service: |
    [SERVICE]
      Daemon Off
      Flush {{ .Values.flush }}
      Log_Level {{ .Values.logLevel }}
      Parsers_File parsers.conf
      Parsers_File custom_parsers.conf
      HTTP_Server On
      HTTP_Listen 0.0.0.0
      HTTP_Port {{ .Values.metricsPort }}
      Health_Check On

    ## https://docs.fluentbit.io/manual/pipeline/inputs
  inputs: |
    [INPUT]
      Name tail
      Path /var/log/containers/*_kong_*.log
      multiline.parser docker, cri
      Tag kong.*
      Mem_Buf_Limit 5MB
      Skip_Long_Lines On

    [INPUT]
      Name tail
      Path /var/log/containers/*_kube-system_*.log
      multiline.parser docker, cri
      Tag kube.*
      Mem_Buf_Limit 5MB
      Skip_Long_Lines On

  ## https://docs.fluentbit.io/manual/pipeline/filters
  filters: |
    [FILTER]
      Name kubernetes
      Match kong.*
      Merge_Log On
      Keep_Log Off
      K8S-Logging.Parser On
      K8S-Logging.Exclude On

    [FILTER]
      Name Kubernetes
      Match kube.*
      Merge_Log On
      Keep_Log Off
      K8S-Logging.Parser On
      K8S-Logging.Exclude On

  ## https://docs.fluentbit.io/manual/pipeline/outputs
  outputs: |
    [OUTPUT]
      Name es
      Match kong.*
      Host elasticsearch-master
      Port 9243
      HTTP_User admin
      HTTP_Passwd Admin@123
      Logstash_Format On
      Logstash_Prefix kong
      Retry_Limit False

    [OUTPUT]
      Name es
      Match kube.*
      Host elasticsearch-master
      Port 9243
      HTTP_User admin
      HTTP_Passwd Admin@123
      Logstash_Format On
      Logstash_Prefix kong
      Retry_Limit False

  ## https://docs.fluentbit.io/manual/pipeline/parsers
  customParsers: |
    [PARSER]
      Name docker_no_time
      Format json
      Time_Keep Off
      Time_Key time
      Time_Format %Y-%m-%dT%H:%M:%S.%L
Create Cluster Override
- Create the
values.yamlfile. See the YAML settings above. - In the Console, select the project for Fluent Bit.
- Select Infrastructure > Cluster Override.
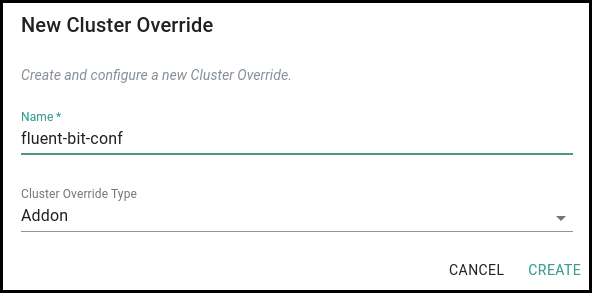
- Click New Override.
-
Enter a name for the cluster override, then click Create.
-
For Resource Selector, select the Add-On name.
-
Under Placement, for Type, select Specific Clusters.
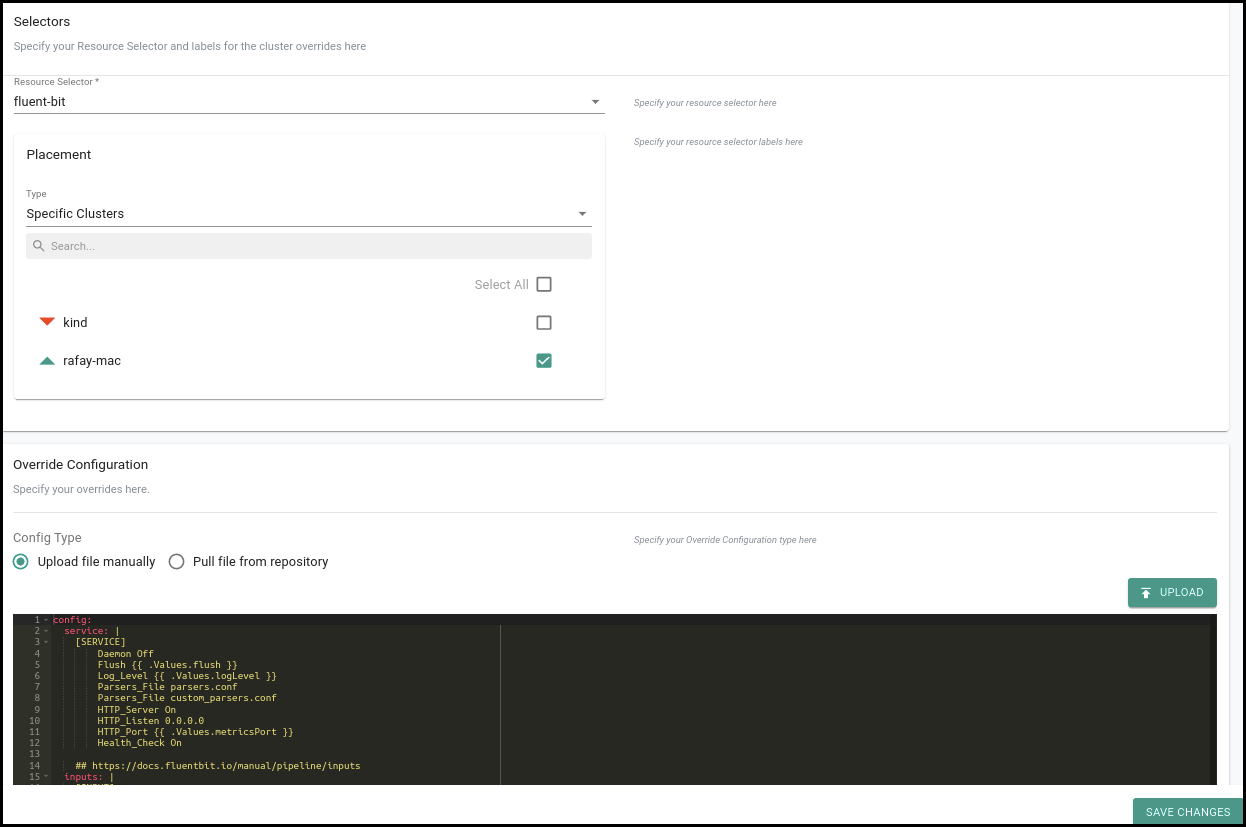
-
Under Override Configuration, click Upload, select the
values.yamlfile, then click Open. The contents of the file display on the page. - Click Save Changes.
- Select Infrastructure > Blueprints.
-
Under Add-Ons, click ADD MORE and select the Fluent Bit Add-On.
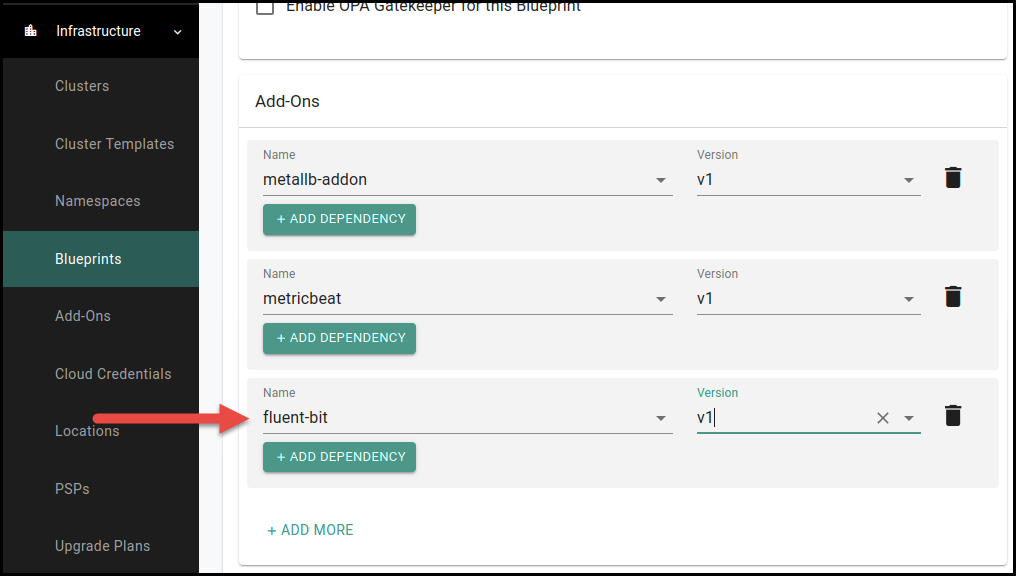
-
Click SAVE CHANGES.
- Select Infrastructure > Clusters.
-
Click the gear icon (settings) for the cluster, then click Update Blueprint.
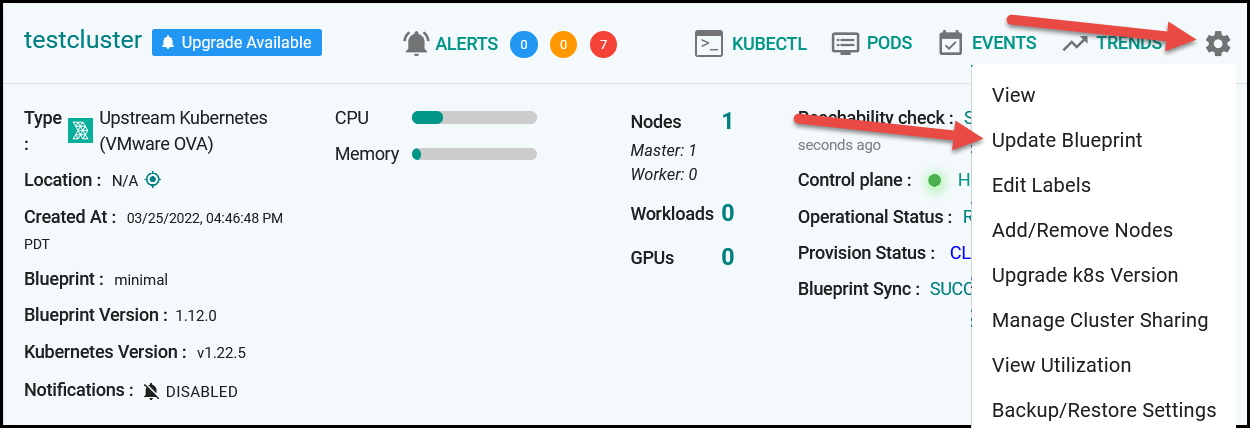
-
Select the updated blueprint, then click SAVE AND PUBLISH. The cluster updates with the new add-on.
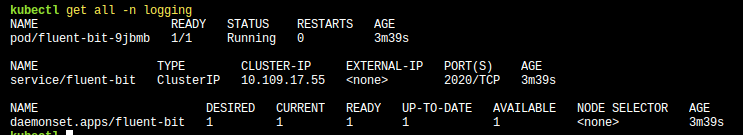
- After the update completes, verify the update by running the following command.
kubectl get all -n logging
The output should look like the following.
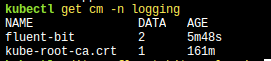
To verify that the custom values.yaml file deployed successfully, run the following command.
kubectl get cm -n logging
The output should look like the following.
To check the configuration, run the following command. This will open a file to verify the values.
kubectl edit cm fluent-bit -n logging
Log Visualization in Kibana
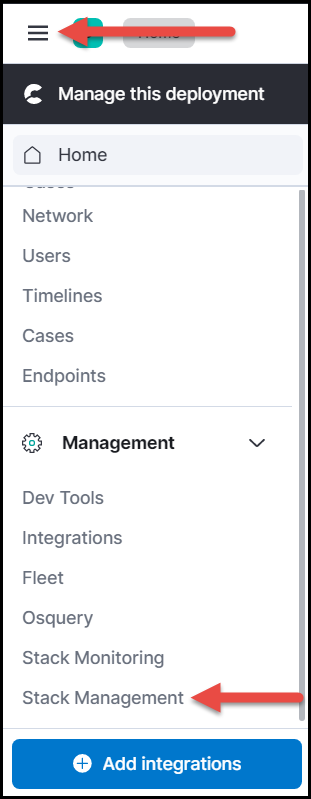
-
In the Elastic console, click the menu icon, then click Stack Management.
-
In the menu, under Kibana, click Index Patterns.
-
Click Create index pattern. The indexes added by the custom
values.yamlfile are listed on the page.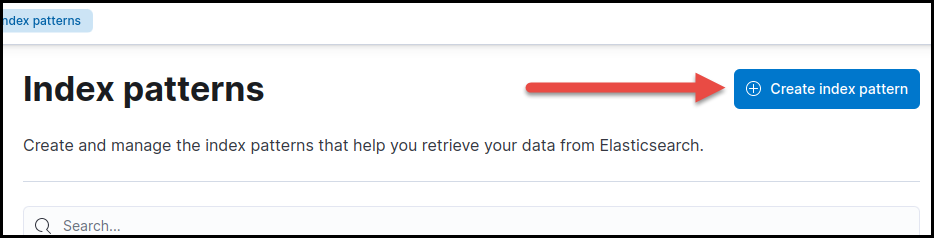
-
Enter
kong-*for the Name,@timestampin the Timestamp field, then click Craete index pattern.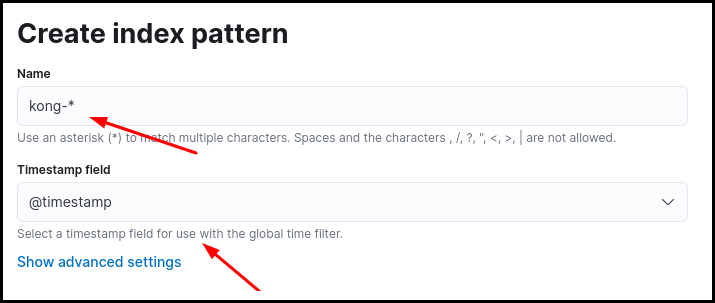
-
In the menu, click Discover under Analytics.
-
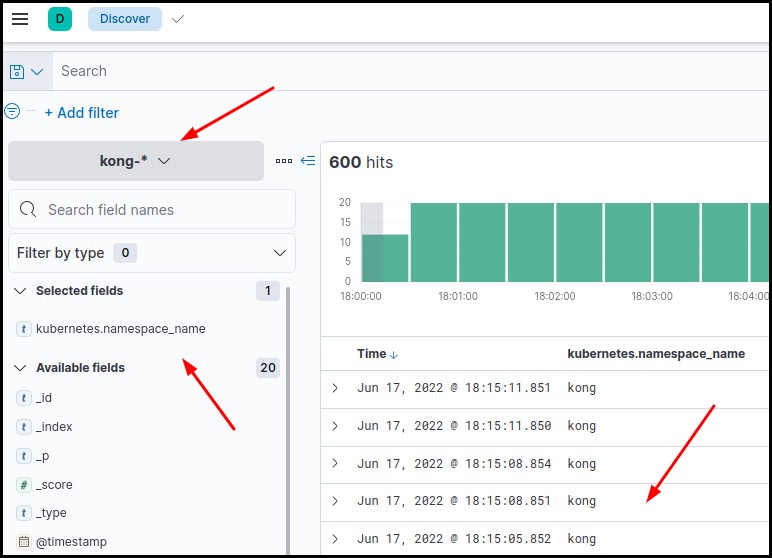
Select the
kong-*index pattern. The logs for the namespace are displayed.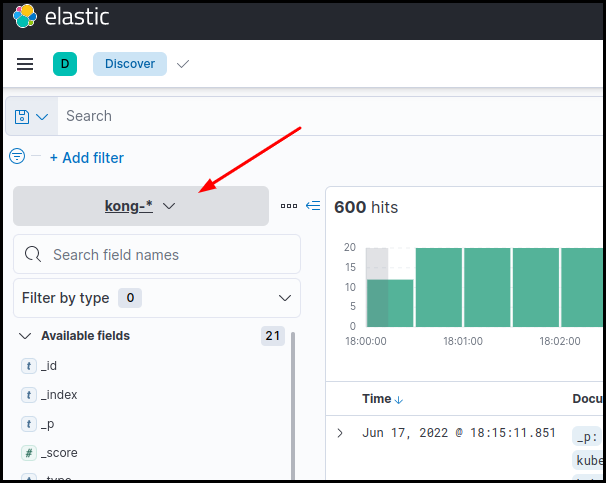
-
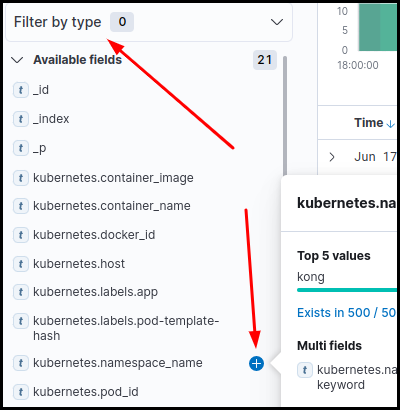
To verify that the logs are coming from a specific namespace, select kubernetes.namespace_name from the Filter by type list.
-
Check the namespace name from where the logs are fetched from.
Note
Add as many indexes and separate logs from different namespaces as needed.
Exclude Namespaces
There may be times where it is easier to exclude some namespaces when gathering the logs for all of the other namespaces. In this scenario, add the Exclude_path option in the Fluent Bit configuration file.
Exclude multiple namespaces, separating the namespace names by a comma. In the example below, the rafay-infra and rafay-system namespaces are excluded.
    [INPUT]
      Name tail
      Path /var/log/containers/*.log
      Exclude_Path /var/log/containers/*_rafay-infra_*.log,/var/log/containers/*_rafay-system_*.log
      multiline.parser docker, cri
      Tag kube.*
      Mem_Buf_Limit 5MB
      Skip_Long_Lines On