Visibility
Overview of the Environment Manager Dashboard
Environment Manager Dashboard is a comprehensive page designed to provide detailed insights and management capabilities for your organization's environments, resources, templates, and active users. The dashboard features multiple widgets, each offering valuable information and functionality. The Environments Widget displays counts of active, inactive, and failed environments, with detailed columns and filters to help you track environment status and history. The Resources Widget provides a similar view for resources, showing counts, types, and template versions, along with sorting and export options. The Environment Templates and Resource Templates Widgets give you detailed views of templates, including version histories and links to individual templates. Lastly, the Active Users Widget shows the count of active users and their associated environments, enabling easy monitoring of user activity.
Benefits of Using the Environment Manager Dashboard
Using the Environment Manager Dashboard offers several compelling benefits for managing and optimizing your organization's environments, resources, templates, and user activities:
- Centralized Management: Consolidates essential information in one place, making it easier to oversee and manage your infrastructure.
- Real-Time Insights: Provides up-to-date information on active, inactive, and failed environments.
- Detailed Analysis: Offers detailed columns and filters for in-depth tracking of template versions, modification history, and resource types.
- Streamlined Tasks: Allows for searching, sorting, and exporting data, saving time and reducing complexity.
- Proactive Monitoring: Helps identify and address potential issues before they impact operations.
- Template Insights: Ensures up-to-date configurations by providing insights into environment and resource templates.
- User Activity Tracking: Monitors active users and their associated environments for better user management and resource allocation.
- Informed Decision-Making: Supports informed decisions with comprehensive data and insights, optimizing resource usage, planning for capacity, and enhancing overall system performance.
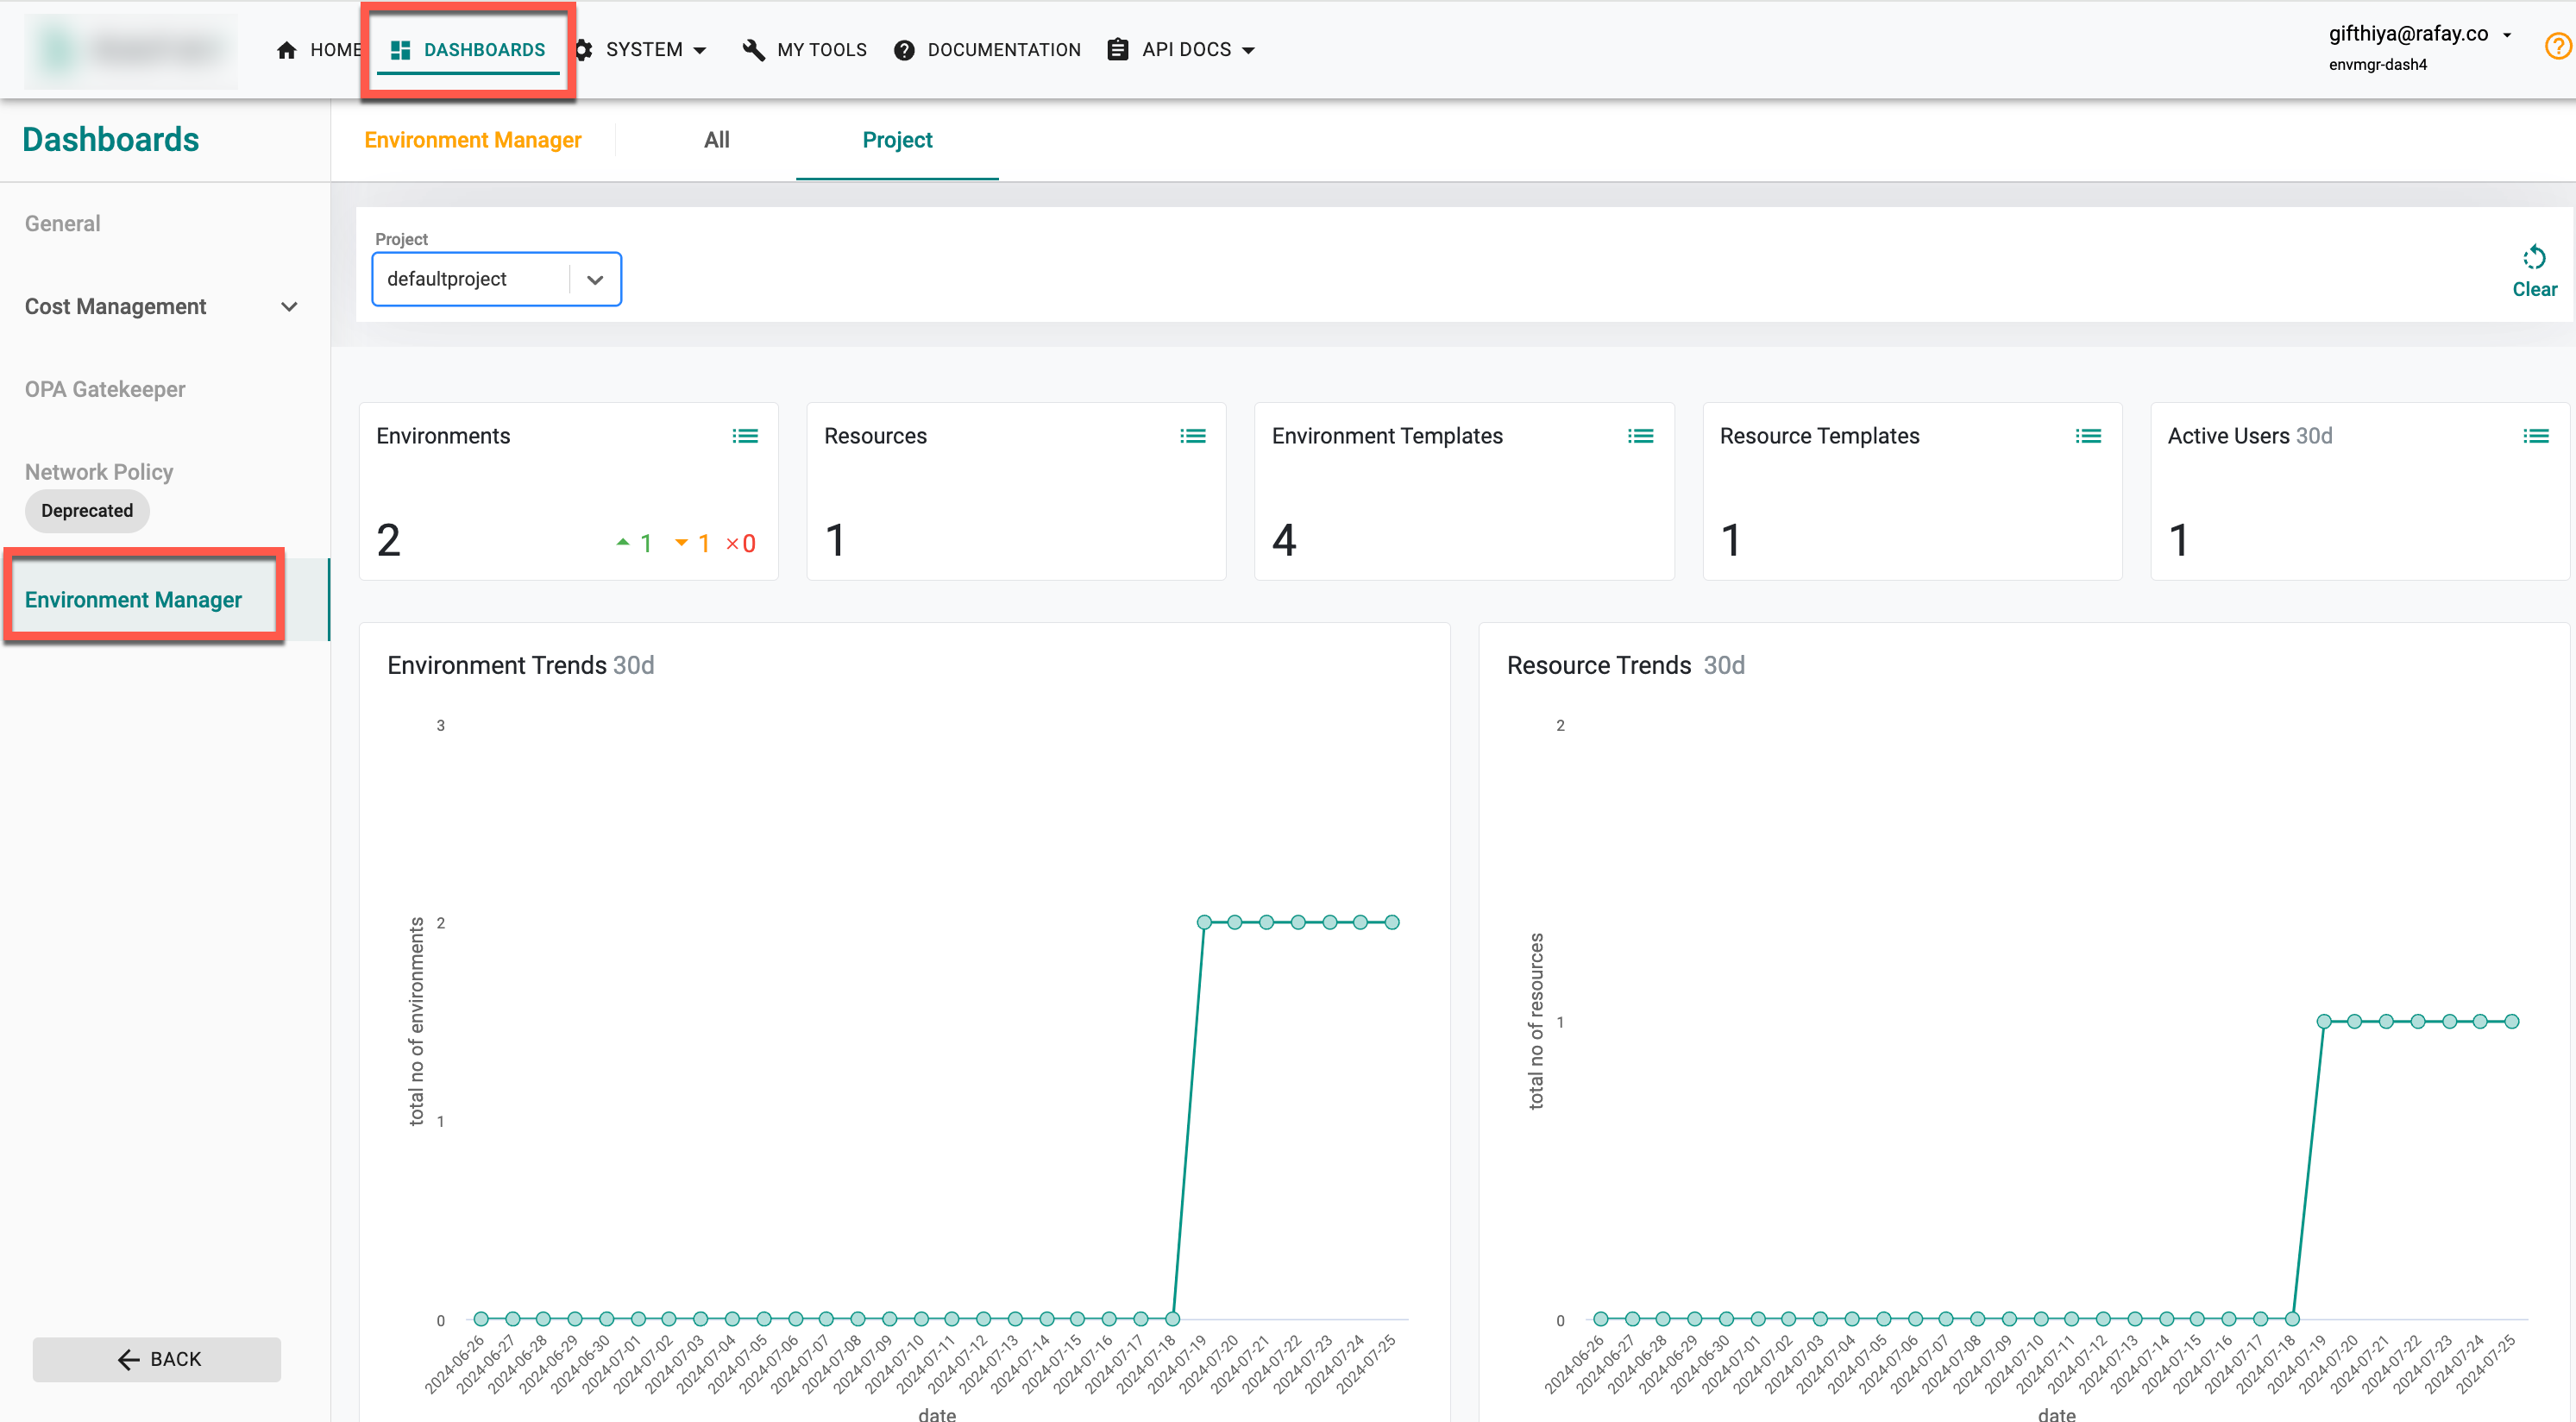
The Environment Manager dashboard provides insights at both the project level and the organization level. By default, the page shows the project-level insights. To view detailed insights at Org level, click on All tab.
Widgets
Explore the various widgets to get an overview, and track trends of environment manager.
-
Environments: The Environment widget displays counts of Active, Inactive, and Failed environments. Click on the ellipsis icon to know more about the environments which includes information for Environment Name, Project, Status (Active, Inactive, Failed), Environment Template, Environment Template Version, Created at, Last Modified, and a ‘GO TO ENVIRONMENT’ link. It provides filters for Project, Status, Environment Template, and Environment Template Version, and allows for searching by name. The status of the environment is based on the last run’s outcome:
- Active: Last run successful with non-zero resources
- Inactive: Last run successful with zero resources
- Failed: Last run failed
For existing environments (those created before the 2.10 release), the environment status is determined as follows: - Inactive: Zero resources deployed - Active: Non-zero resources deployed
-
Resources: The Resources widget displays the count of resources currently deployed in environments. Clicking on the ellipsis icon reveals details such as Project, Resource Type (Static, Dynamic), Environment Name, Resource Template, Resource Template Version, Created At, and Last Modified. It provides filters for Project, Resource Type, Environment Name, Resource Template and Resource Template Version, and allows for searching by name.
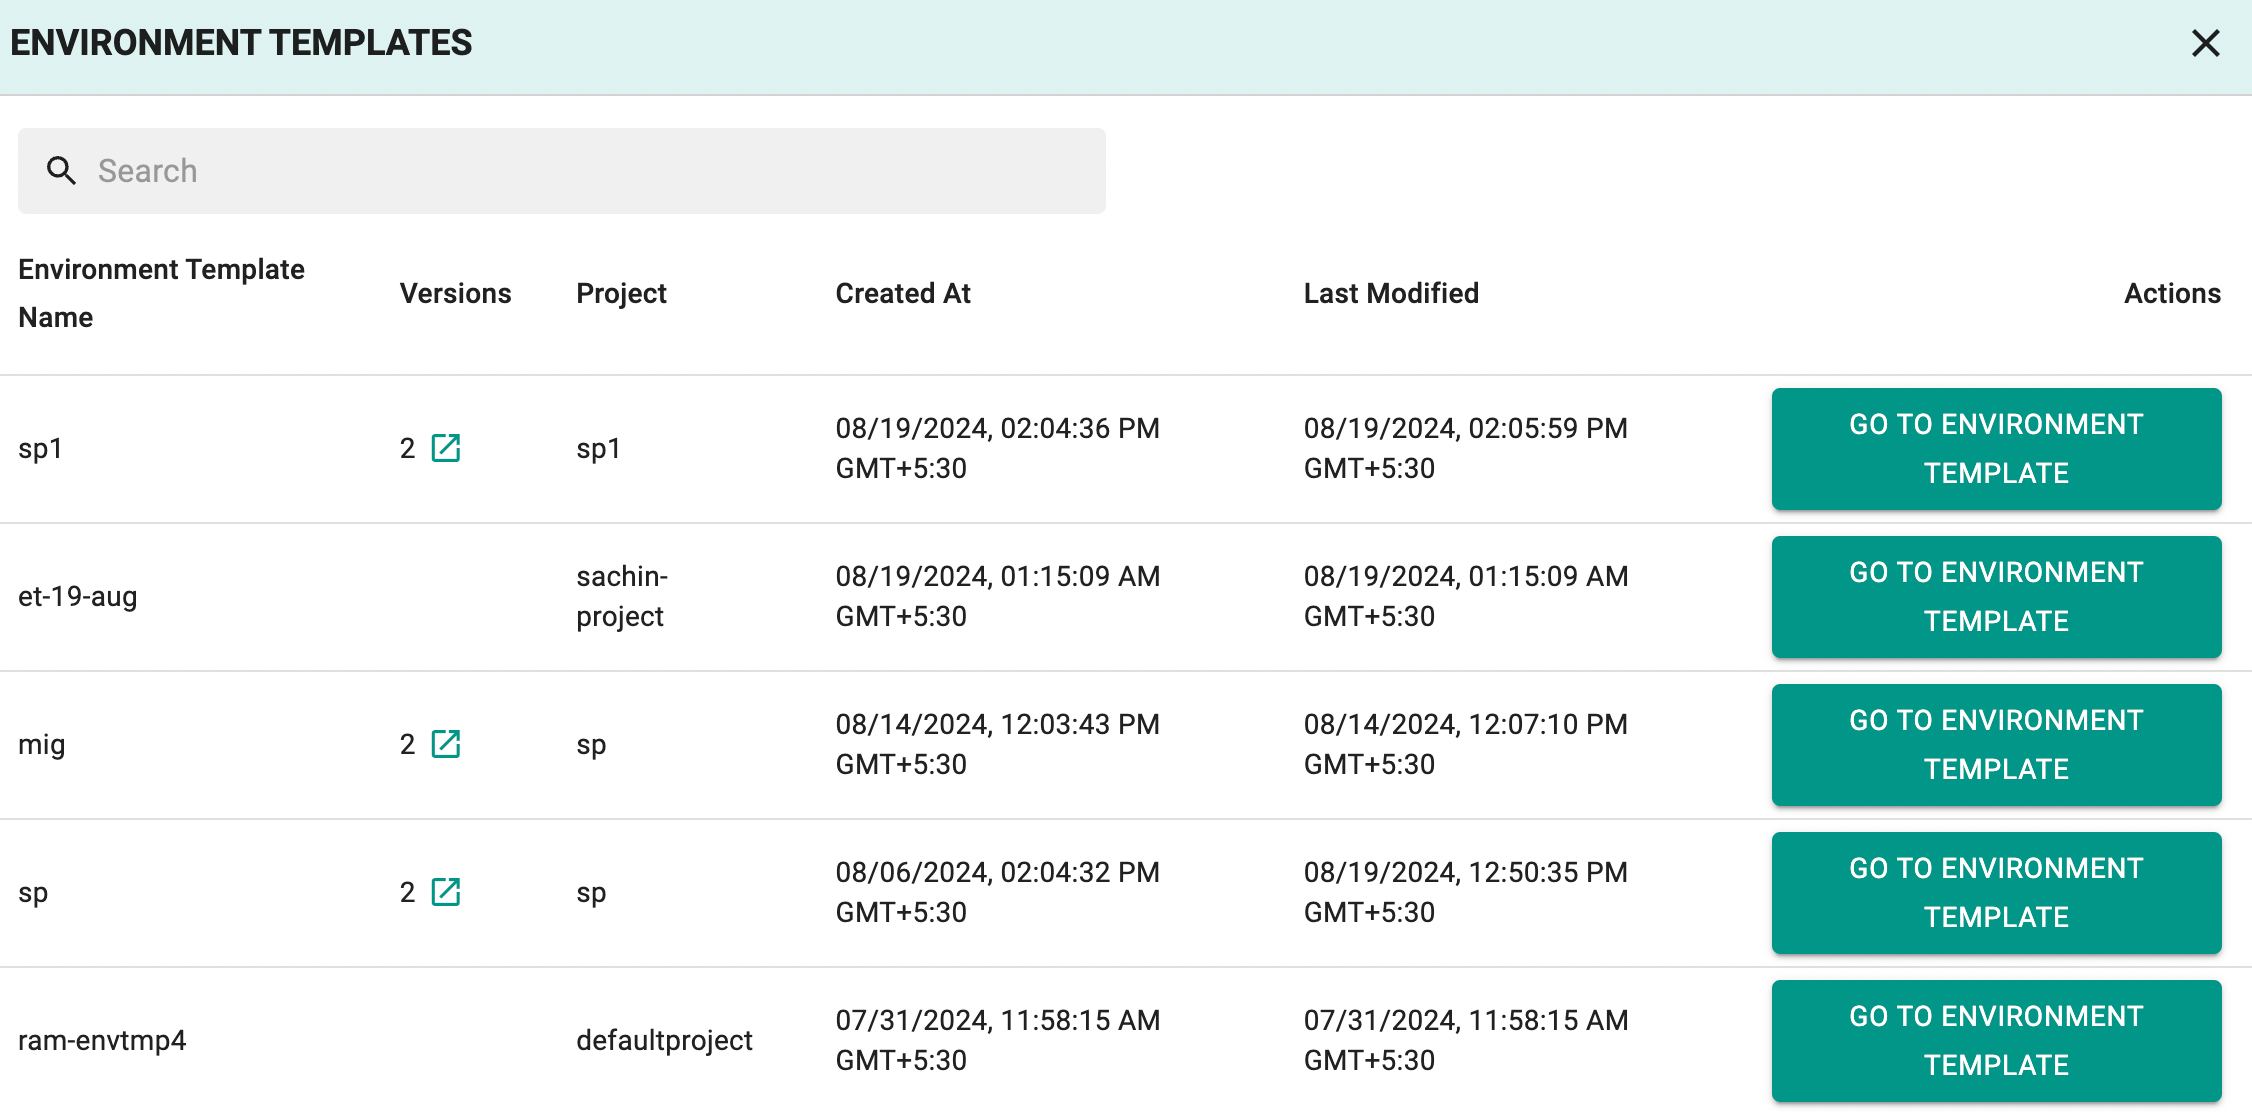
- Environment Templates: The Environment Templates widget displays the count of all the available environment templates. Clicking on the ellipsis icon reveals details such as Environment Template Name, Number of Versions along with Version Names, Project, Created at, Last Modified, and a ‘GO TO ENVIRONMENT TEMPLATE’ link. It provides a search bar to find the required template.
- Resource Template: The Resource Template widget displays the count of all the available resource templates. Clicking on the ellipsis icon reveals details such as Resource Template Name, Number of Versions along with the Version Names, Project, Created at, Last Modified, and a ‘GO TO RESOURCE TEMPLATE’ link. It provides a search bar to find the required template.
-
Active Users: The Active Users widget displays the count of active users. Clicking on the ellipsis icon reveals details such as User, Type (IDP/Local), Associated Environments, and a ‘GO TO USER’ link. The count of Associated Environments, when selected, will display a list of environments associated with the user.
Note: Active Users widget will only display the count and details of users who have interacted with environments after the 2.10 release.
Here is an example image displaying the details of the Environment Template.
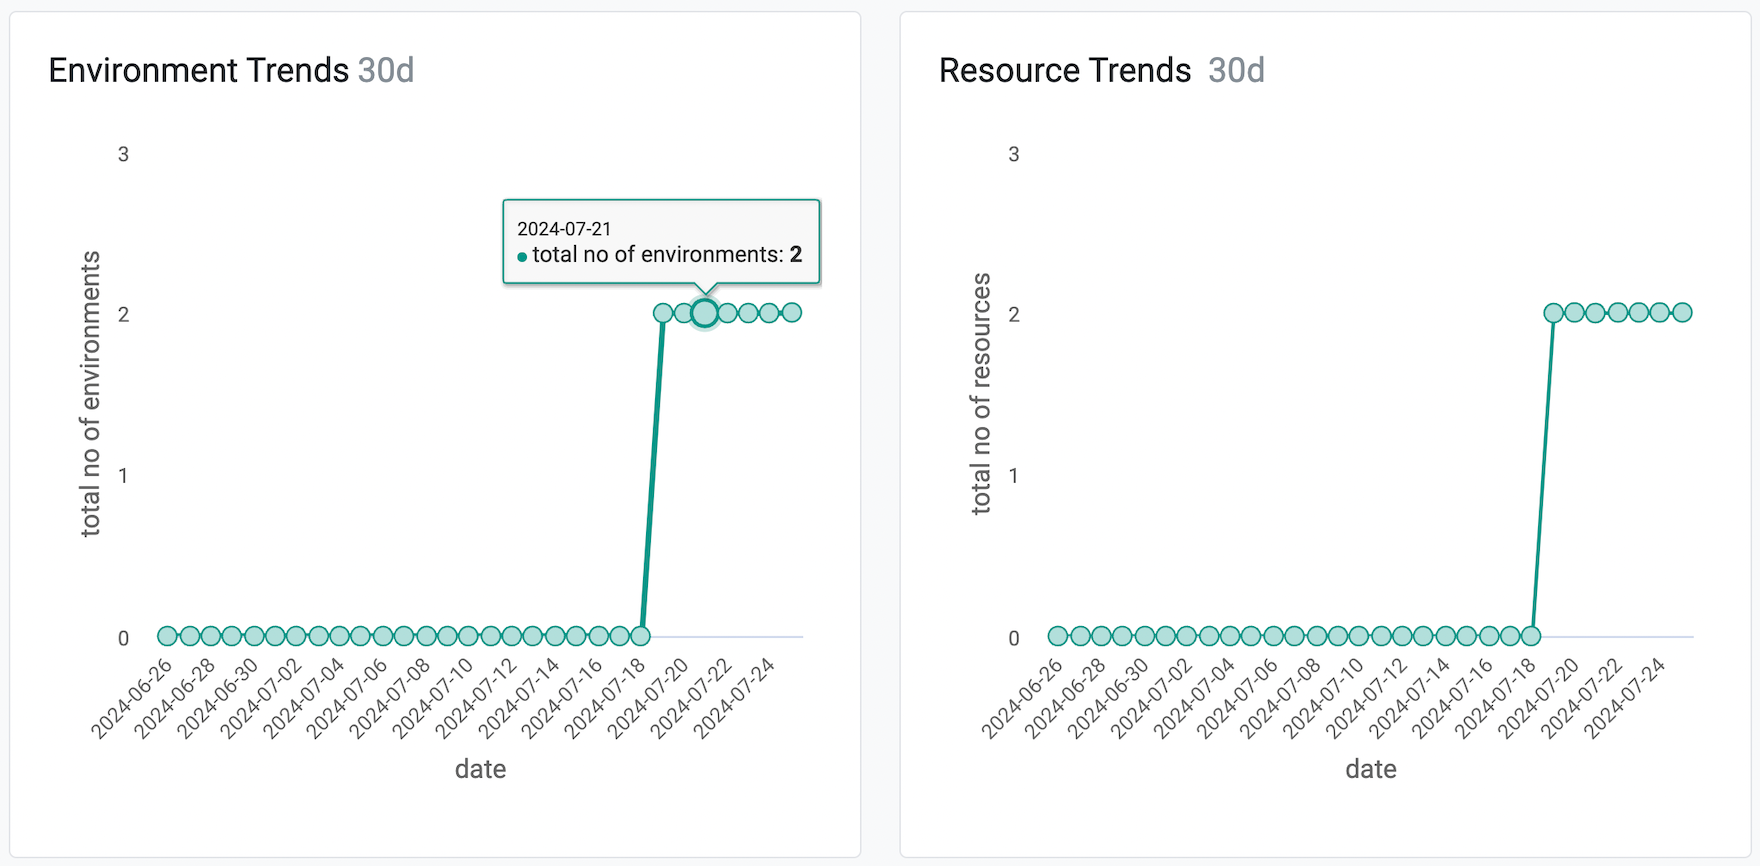
- Environment Trends: The "Environment Trends 30d" chart provides valuable insights into the number of environments over a 30-day period. It is useful for identifying periods of stability or change, helping to track when new environments are created or existing ones are decommissioned. The chart includes information on the total number of environments at each point in time, allowing for easy monitoring of trends and significant events impacting the environment count. Hover over the graph to view the specific dates and the number of environments available on the selected date, offering a detailed view of resource changes over time.
- Resource Trends: The "Resource Trends 30d" chart is useful for monitoring the total number of resources over a 30-day period. It helps identify periods of stability or change, tracking when new resources are added or existing ones are removed. The chart provides information on the total number of resources at each point in time, allowing for easy monitoring of trends and significant events impacting resource count. Hover over the graph to view the specific dates and the number of resources available on the selected date, offering a detailed view of resource changes over time.
- Environments: The "Environments" tabular widget displays a list of environments along with the associated number of environment templates and resource templates used by the environments. Clicking on the ellipsis icon reveals details such as Environment Name, Status, Environment Template, Environment Template Version, Created At, Last Modified, and a ‘GO TO ENVIRONMENT’ link. It provides filters for status, environment template, and environment template version.
For an organization-wide perspective, the "Project" tab in the Environments tabular widget provides a summary of projects and their associated environments. This view lists each project along with the count of environments and additional details, helping to manage and analyze environments across the organization.
- Resources: The "Resources" tabular widget displays a list of resources along with the associated number of resource templates used by the resources. Clicking on the ellipsis icon reveals details such as Resource Name, Resource Type, Environment Name, Environment Template, Resource Template Version, Created At, and Last Modified. It provides filters for Resource Type, Environment Name, Resource Template, Resource Template Version.
For an organization-wide perspective, the "Project" tab in the Environments tabular widget provides a summary of projects and their associated resources. This view lists each project along with the count of resources and additional details, helping to manage and analyze resources across the organization.


