Visibility
Introduction
The OPA Gatekeeper Overview dashboards offer an overview of multiple metrics generated at the cluster and project levels, providing visibility and insights. They give a high-level view of the current state and blocked policy violations for Projects, Clusters, and Namespaces. The accessibility is controlled based on the assigned role.
Getting to the Dashboards
The dashboard card provides visibility into the policy status and compliance level of each application and service, allowing teams to quickly identify and address any issues or violations. This helps to ensure compliance with internal policies and regulatory requirements.
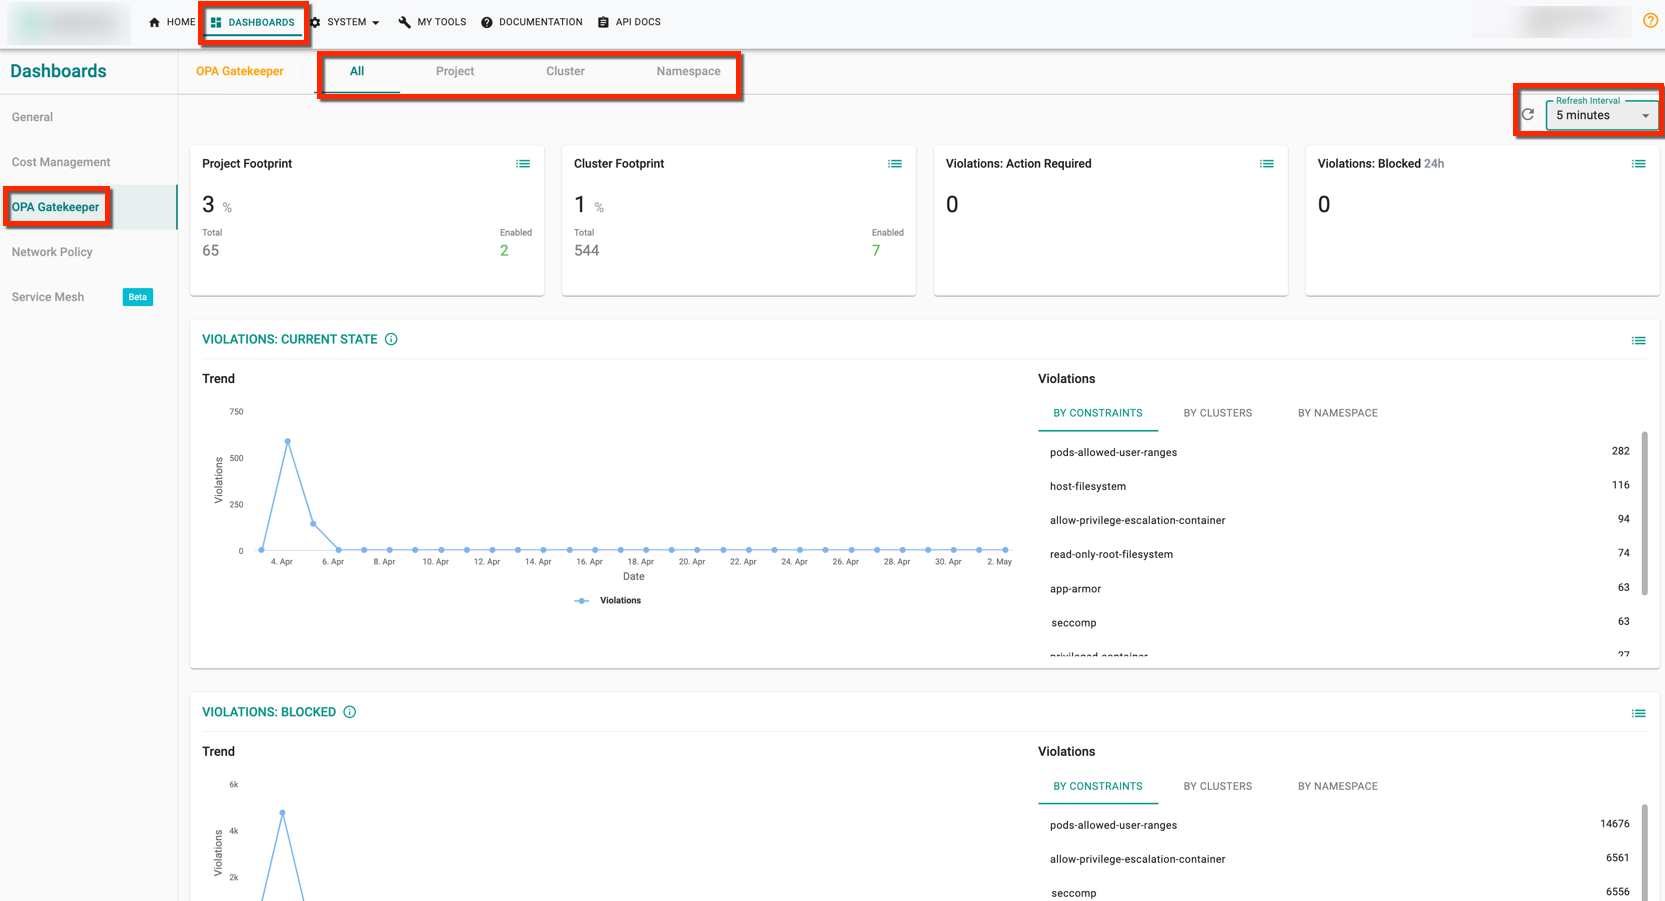
- Login to the controller and click on dashboards
- Select OPA Gatekeeper
-
Use the appropriate tabs to view the violation metrics
- All tab shows a central view of the policy violations across all projects and clusters
- Project tab shows the policy violations at a project level
- Cluster tab shows the policy violations at a cluster level
- Namespace tab shows the policy violations at a namespace level
By default, All tab is selected.
- Use the Refresh filter to set a time interval for how often a dashboard or report should automatically refresh data (30 seconds, 1 minute, 5 minutes, and 10 minutes). By default, the data ie refreshed for very 5 minutes
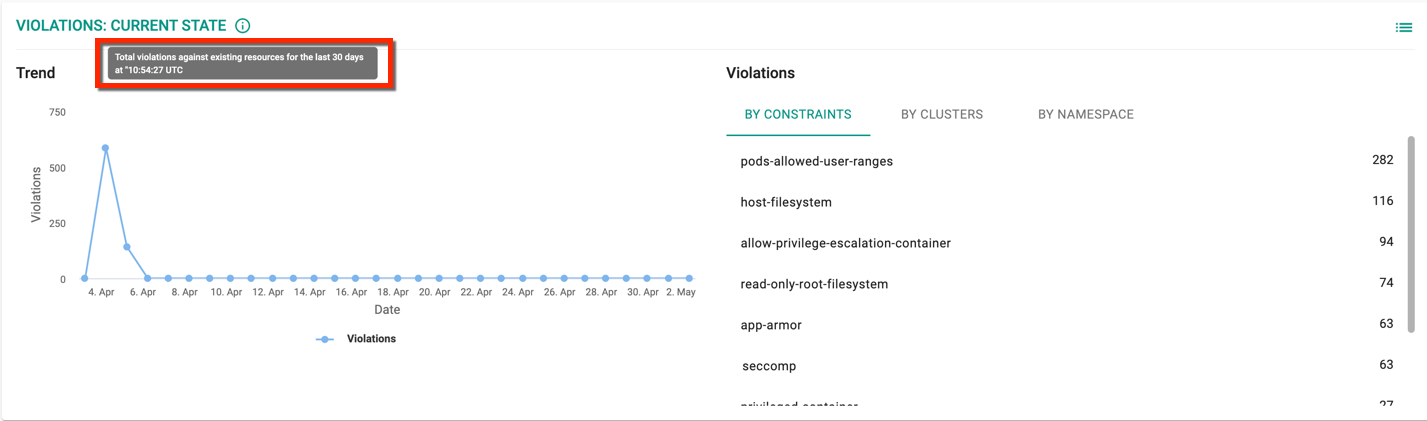
Mouse hover on the tooltip (i) to know more about the metrics
For example, hovering over the Violations: Current State tooltip shows the info as Total violations against existing resources for the last 30 days
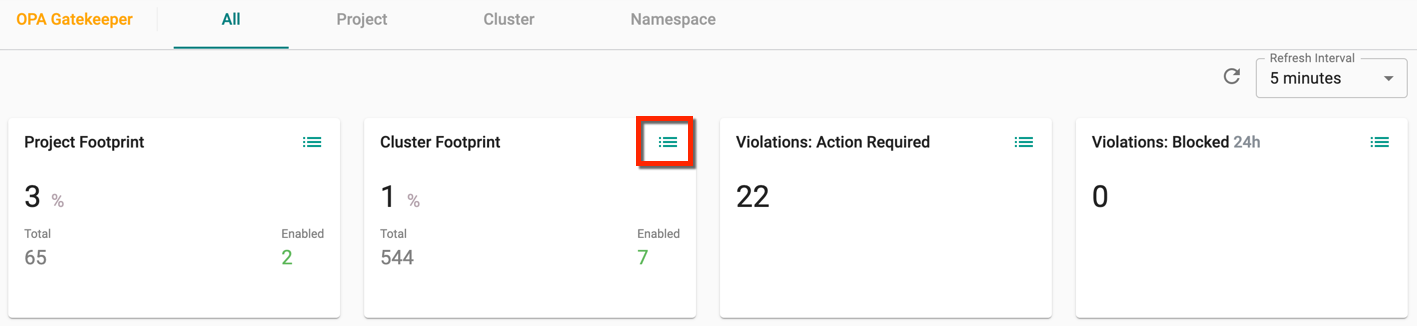
Violation Metrics
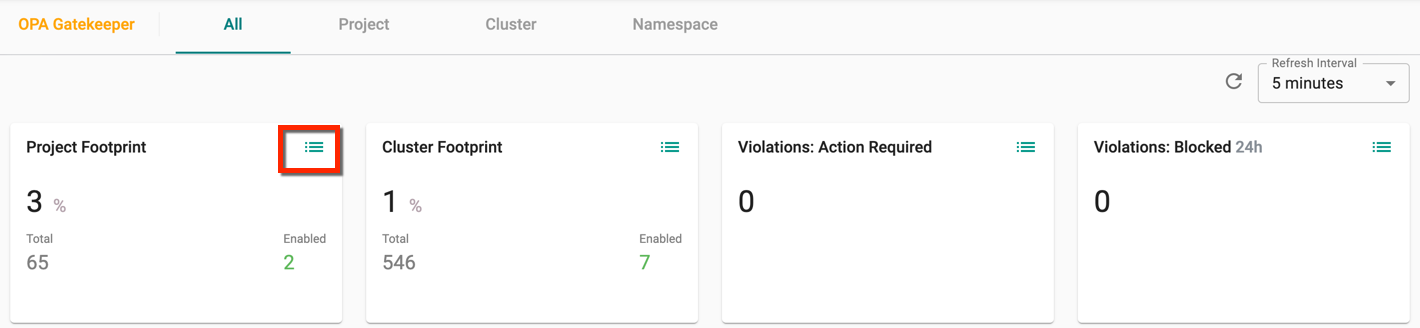
Project Footprint
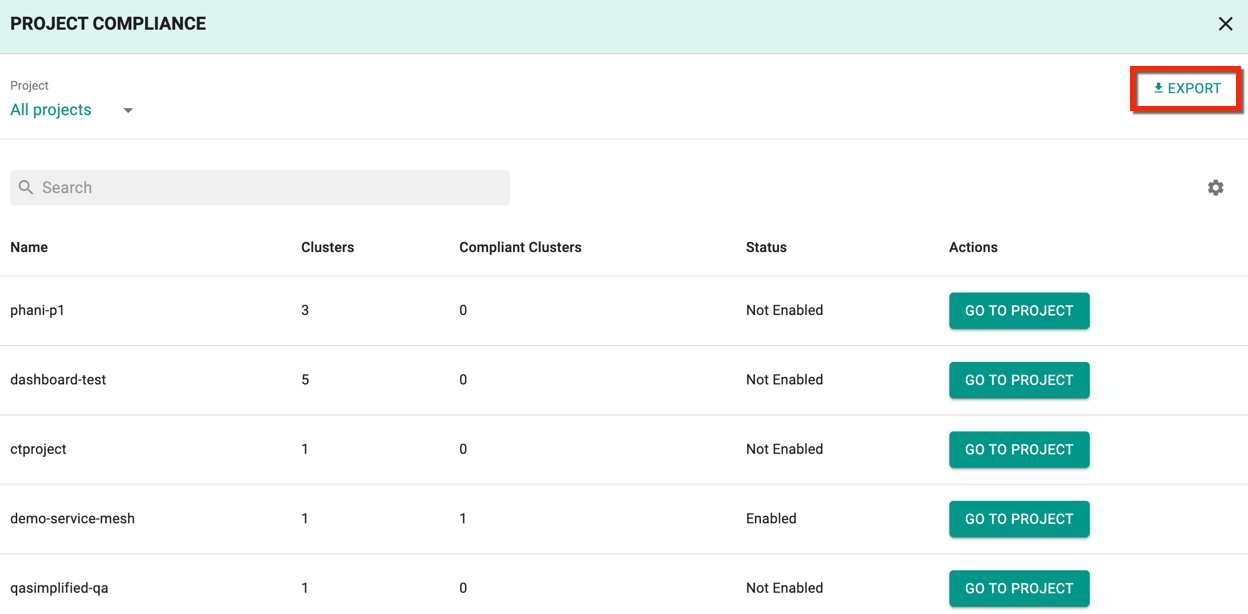
Project Footprint shows the percentage of projects in which all the clusters have OPA Gatekeeper enabled, Total number of projects and number of projects that has OPA Gatekeeper enabled. Clicking on View list icon shows the list of projects, number of clusters within those projects, and status of OPA Enablement (Enabled/Not Enabled)
You can also download this report using the Export button available at the top right corner
Cluster Footprint
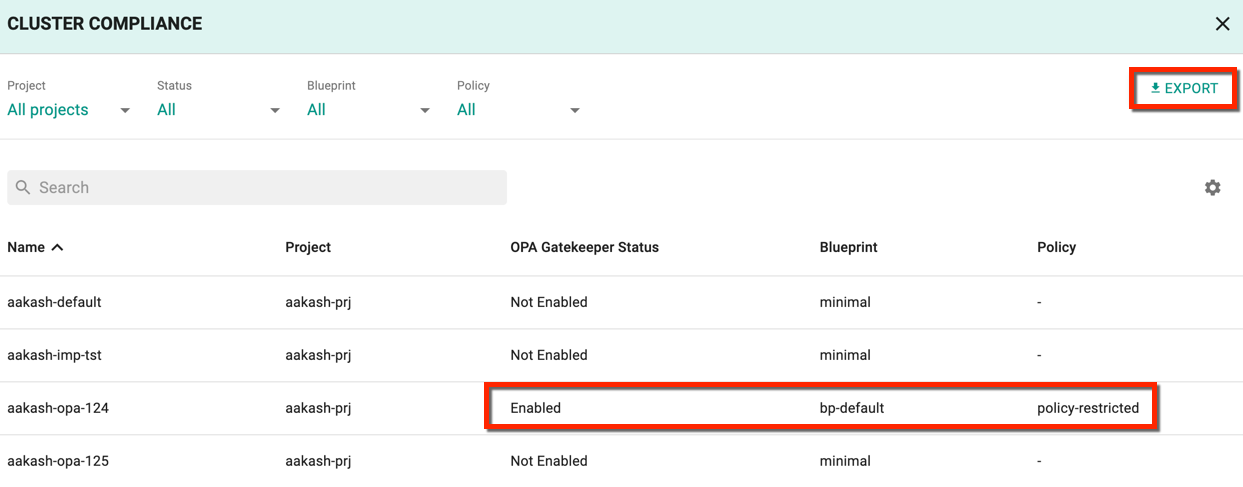
Cluster Footprint shows the percentage of clusters for which OPA Gatekeeper has been enabled, total number of clusters and number of clusters that has OPA Gatekeeper enabled. Clicking on View list icon shows the list of clusters, the project to which those clusters belong, status of OPA Enablement (Enabled/Not Enabled) and the policy name (if enabled)
You can also download this report using the Export button available at the top right corner
Violations: Action Required
Shows the number of violations detected against existing resources based on periodic audits and this indicates the user to take action on the violations. Clicking on View list icon shows the list of clusters, the project to which those clusters belong, namespace, resource name/type, constraint name, enforcement action, and message. You can also download this report as a .csv file using the Export button available at the top right corner
Violations: Blocked
Shows the number of violations that are successfully prevented based on the OPA Configurations. This validation happens whenever a resource is created, updated or deleted. Clicking on View list icon shows the constraint details list of clusters, the project to which those clusters belong, namespace, resource name/type, constraint name, enforcement action, and message. You can also download this report as a .csv file using the Export button available at the top right corner
Violation Trend
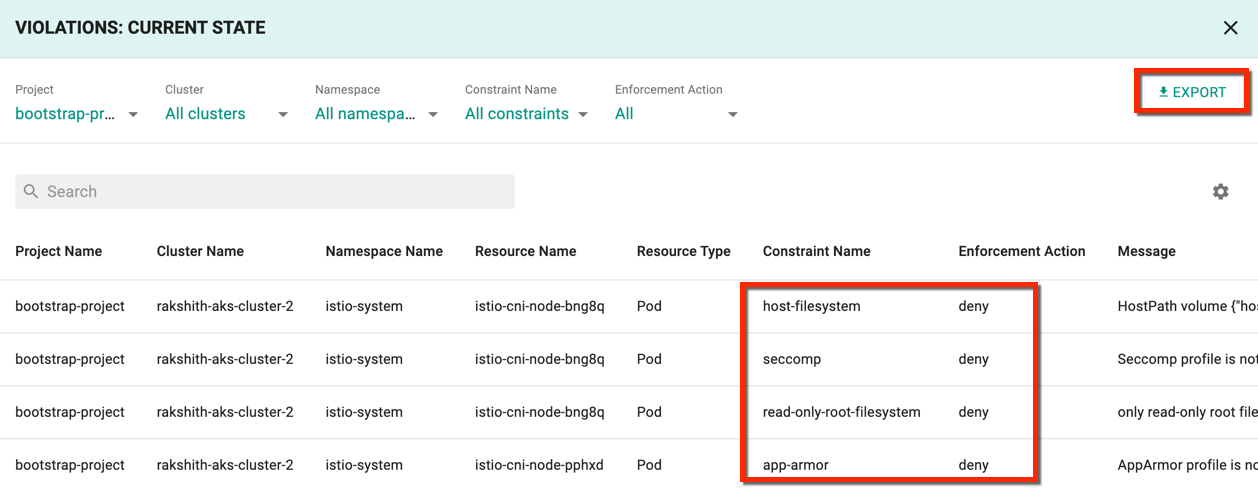
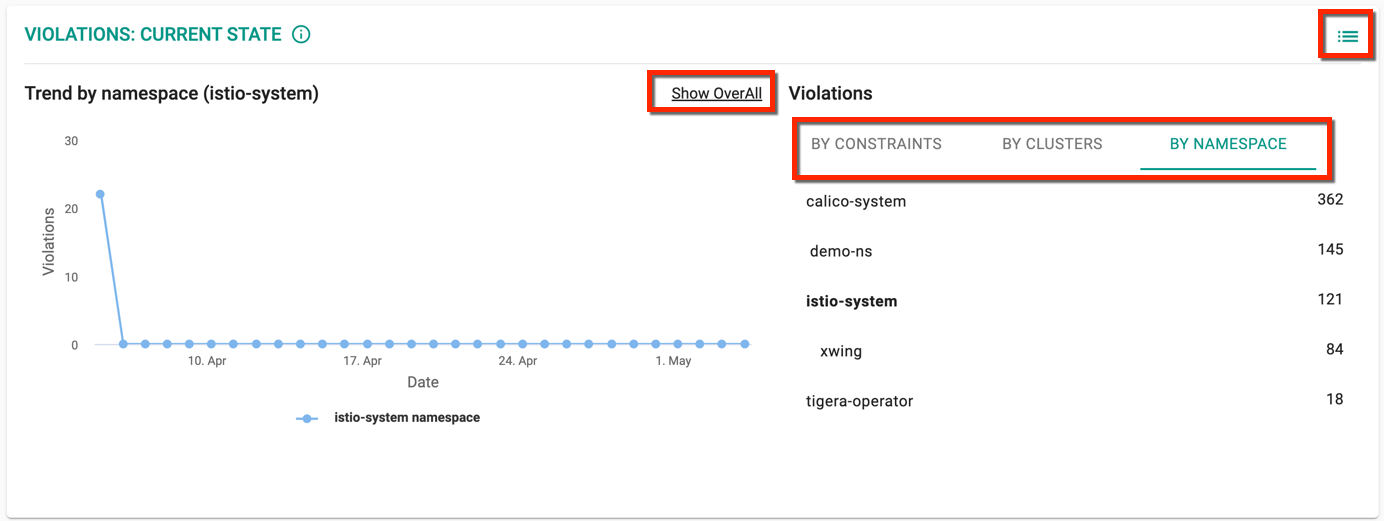
Violations: Current State
Violations: Current State has a graphical representation to show the trend of violations on the K8s resources for 30 days that need immediate actions. Mouse hover the graph to view the number of violations existing on a specific date. There are three tabs within this widget:
- By Constraint: Select one of the constraint to view the number of times the constraint exist on a specific date
- By Clusters: Select one of the cluster to view the list of constraints that exist on the selected cluster along with the number of times those constraints occurred on a specific date
- By Namespace: Select one of the namespace to view the constraints that exist on the selected namespace along with the number of time those constraints occurred on a specific date
To view the overall violation status, click Show OverAll to reset the trend. Click View List to get the list of all projects, clusters, namespace, resources, constraints, and enforcement action. You can also export the report as a .csv file.
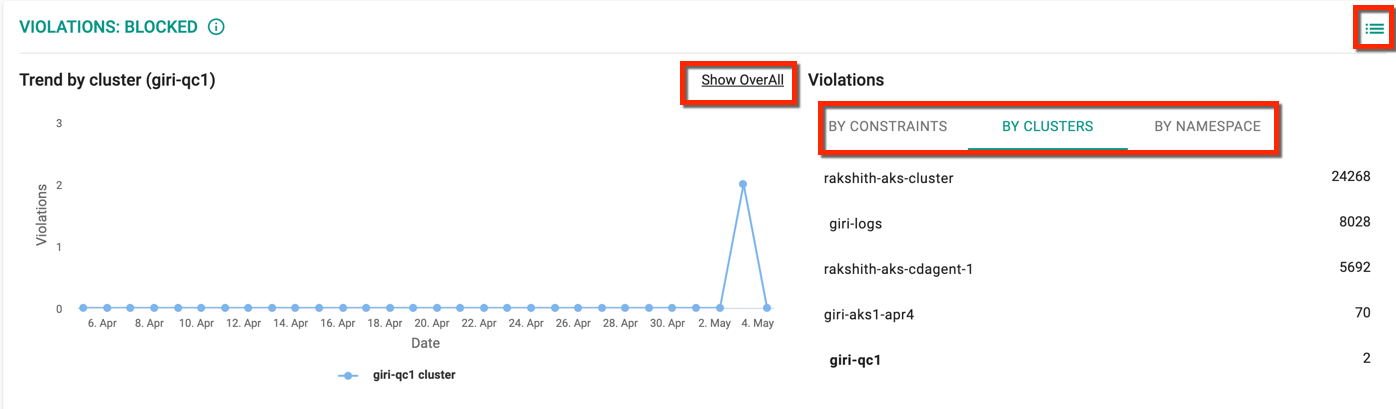
Violations: Blocked
Violations: Blocked has a graphical representation to show the trend of violations for 30 days that are blocked on the existing K8s resources. Mouse hover the graph to view the number of violations existing on a specific date. There are three tabs within this widget:
- By Constraint: Select one of the constraint to view the number of times the constraint occurred on a specific date
- By Clusters: Select one of the cluster to view the constraints that are blocked on the selected cluster along with the number of times those constraints occurred on a specific date
- By Namespace: Select one of the namespace to view the constraints that are blocked on the selected namespace along with the number of time those constraints occurred on a specific date
To view the overall blocked violation details, click Show OverAll to reset the trend. Click View List to get the list of all projects, clusters, namespace, resources, constraints, and enforcement action. You can also export the report as a .csv file.