Simulator
It is increasingly common for Kubernetes clusters to be deployed and operated on remote edge environments. For examples, ships, planes, trains etc. These clusters deployed on a remote edge are required to operate under a special set of "networking" constraints such as:
- Low network bandwidth
- Unreliable network connectivity
- Intermittent network connectivity
Organizations may wish to "simulate" and "test" the network characteristics of a remote Kubernetes edge cluster in their lab environment. This document describes a number of test cases and tools that can be leveraged to simulate a remote edge cluster.
Important
This document does not attempt to capture "tests" related to compute, memory and storage characteristics for edge clusters because standard tests can be used to validate these.
Assumptions
- A common form factor for a remote edge cluster is a single node, converged master/node system based on upstream Kubernetes cluster provisioned and managed by the controller.
- Node OS is based on Ubuntu Linux 18.04 LTS or similar.
- User has remote access with administrative privileges on the node OS powering the node.
- The remote edge cluster is based on the "minimal" cluster blueprint (ensures that only the minimal set of components are deployed on the remote cluster)
Identify Network Interface
We will be configuring rules on a specific network interface. You can identify the name of your network interface using the "ifconfig" command. In the examples below, we will be using "ens3" as our network interface.
Simulate Network Latency
This test case simulates "high latency" between the edge cluster and the controller.
A remote edge may be located 1000s of miles away from the controller with significant latency between the edge and the controller. Organizations may wish to validate how the remotely managed cluster operates under "poor network latency conditions. For example:
- Can the heartbeat between the edge cluster and the controller be maintained? i.e. will the cluster still report as Healthy in the controller under these conditions?
- Can developers and operations personnel remotely access the edge cluster using the zero trust kubectl channel with acceptable performance?
- Can developers deploy, operate and troubleshoot workloads on remote edge clusters?
We will be using the traffic control utility in Linux to control the latency on the network interface. Traffic control (tc) is a very useful Linux utility that gives you the ability to configure the kernel packet scheduler.
Before
Here is an example of network latency before applying a "latency rule" using the traffic control command. In this example, the round trip time for "ping" to google.com is around 9.8ms. This latency is typical for a cluster operating in a datacenter with a high speed Internet connection.
ping google.com
An illustrative example of output you can see is shown below.
PING google.com (172.217.14.110): 56 data bytes
64 bytes from 172.217.14.110: icmp_seq=0 ttl=59 time=9.754 ms
64 bytes from 172.217.14.110: icmp_seq=1 ttl=59 time=9.846 ms
64 bytes from 172.217.14.110: icmp_seq=2 ttl=59 time=9.805 ms
64 bytes from 172.217.14.110: icmp_seq=3 ttl=59 time=9.847 ms
64 bytes from 172.217.14.110: icmp_seq=4 ttl=59 time=9.888 ms

^C--- google.com ping statistics ---
5 packets transmitted, 5 packets received, 0% packet loss
round-trip min/avg/max/stddev = 9.754/9.828/9.888/0.045 ms
After
Remote edge clusters can have significantly higher latency. To add a "200 ms" latency, type in the following command.
tc qdisc add dev ens3 root netem delay 200ms
Now, let us test the latency for ping to google.com. As you can see from the list below, the roundtrip latency now averages "209 ms"
Important
Once you specify the artificial delay, you should notice a perceptible delay in the SSH session to the node OS.
ping google.com
An illustrative example of output you can see is shown below.
PING google.com (172.217.14.110): 56 data bytes
64 bytes from 172.217.14.110: icmp_seq=0 ttl=59 time=209.930 ms
64 bytes from 172.217.14.110: icmp_seq=1 ttl=59 time=209.899 ms
64 bytes from 172.217.14.110: icmp_seq=2 ttl=59 time=209.880 ms
64 bytes from 172.217.14.110: icmp_seq=3 ttl=59 time=209.875 ms
64 bytes from 172.217.14.110: icmp_seq=4 ttl=59 time=209.903 ms
64 bytes from 172.217.14.110: icmp_seq=5 ttl=59 time=209.895 ms
64 bytes from 172.217.14.110: icmp_seq=6 ttl=59 time=209.862 ms
64 bytes from 172.217.14.110: icmp_seq=7 ttl=59 time=209.905 ms
64 bytes from 172.217.14.110: icmp_seq=8 ttl=59 time=209.895 ms
64 bytes from 172.217.14.110: icmp_seq=9 ttl=59 time=209.896 ms
64 bytes from 172.217.14.110: icmp_seq=10 ttl=59 time=209.899 ms
64 bytes from 172.217.14.110: icmp_seq=11 ttl=59 time=209.853 ms
^C--- google.com ping statistics ---
12 packets transmitted, 12 packets received, 0% packet loss
round-trip min/avg/max/stddev = 209.853/209.891/209.930/0.000 ms
Once this "simulated condition" is enabled, the user can perform regular tests as required. For example,
Test 1: Heartbeat
- Login into the Controller's web console
- Navigate to the project where the cluster exists
The remote cluster should still report as Healthy on the web console even under this simulated condition.
Test 2: Kubectl Web Shell
- Click on Kubectl to launch the zero trust kubectl web shell
- Type a command such as "kubectl get po"
The user should still be able to perform kubectl operations on the remote cluster. Note that you may notice a brief delay for first time access due to the JIT service account creation.
Important
You will notice that kubectl operations performed through the zero trust kubectl proxy will be "significantly faster" compared to the same operation performed over "ssh".
Simulate Low Bandwidth
A remote edge may not have high speed network connectivity to the controller. This test case simulates "low network bandwidth" between the edge cluster and the controller. This test case simulates "low bandwidth" between the edge cluster and the controller.
We will be using the traffic control utility in Linux to control the latency on the network interface.
Type the following command replacing "ens3" with the name of your network interface. In this example, we are throttling network bandwidth to "500 kpbs".
sudo tc qdisc add dev ens3 root tbf rate 500kbit burst 32kbit latency 400ms
- tbf: Use the token buffer filter to manipulate traffic rates
- rate: sustained maximum rateburst: maximum allowed burst
- latency: packets with higher latency get dropped
Once this "simulated condition" has been setup and configured, the user can perform regular tests as required. For example,
Test 1: Heartbeat
- Login into the Controller's web console
- Navigate to the project where the cluster exists
The remote cluster should still report as Healthy on the web console even under this simulated condition.
Test 2: Kubectl Web Shell
- Click on Kubectl to launch the zero trust kubectl web shell
- Type a command such as "kubectl get po"
The user should still be able to perform kubectl operations on the remote cluster. Note that you may notice a brief delay for first time access due to the JIT service account creation.
Important
You will notice that kubectl operations performed through the zero trust kubectl proxy will be "significantly faster" compared to the same operation performed over "ssh".
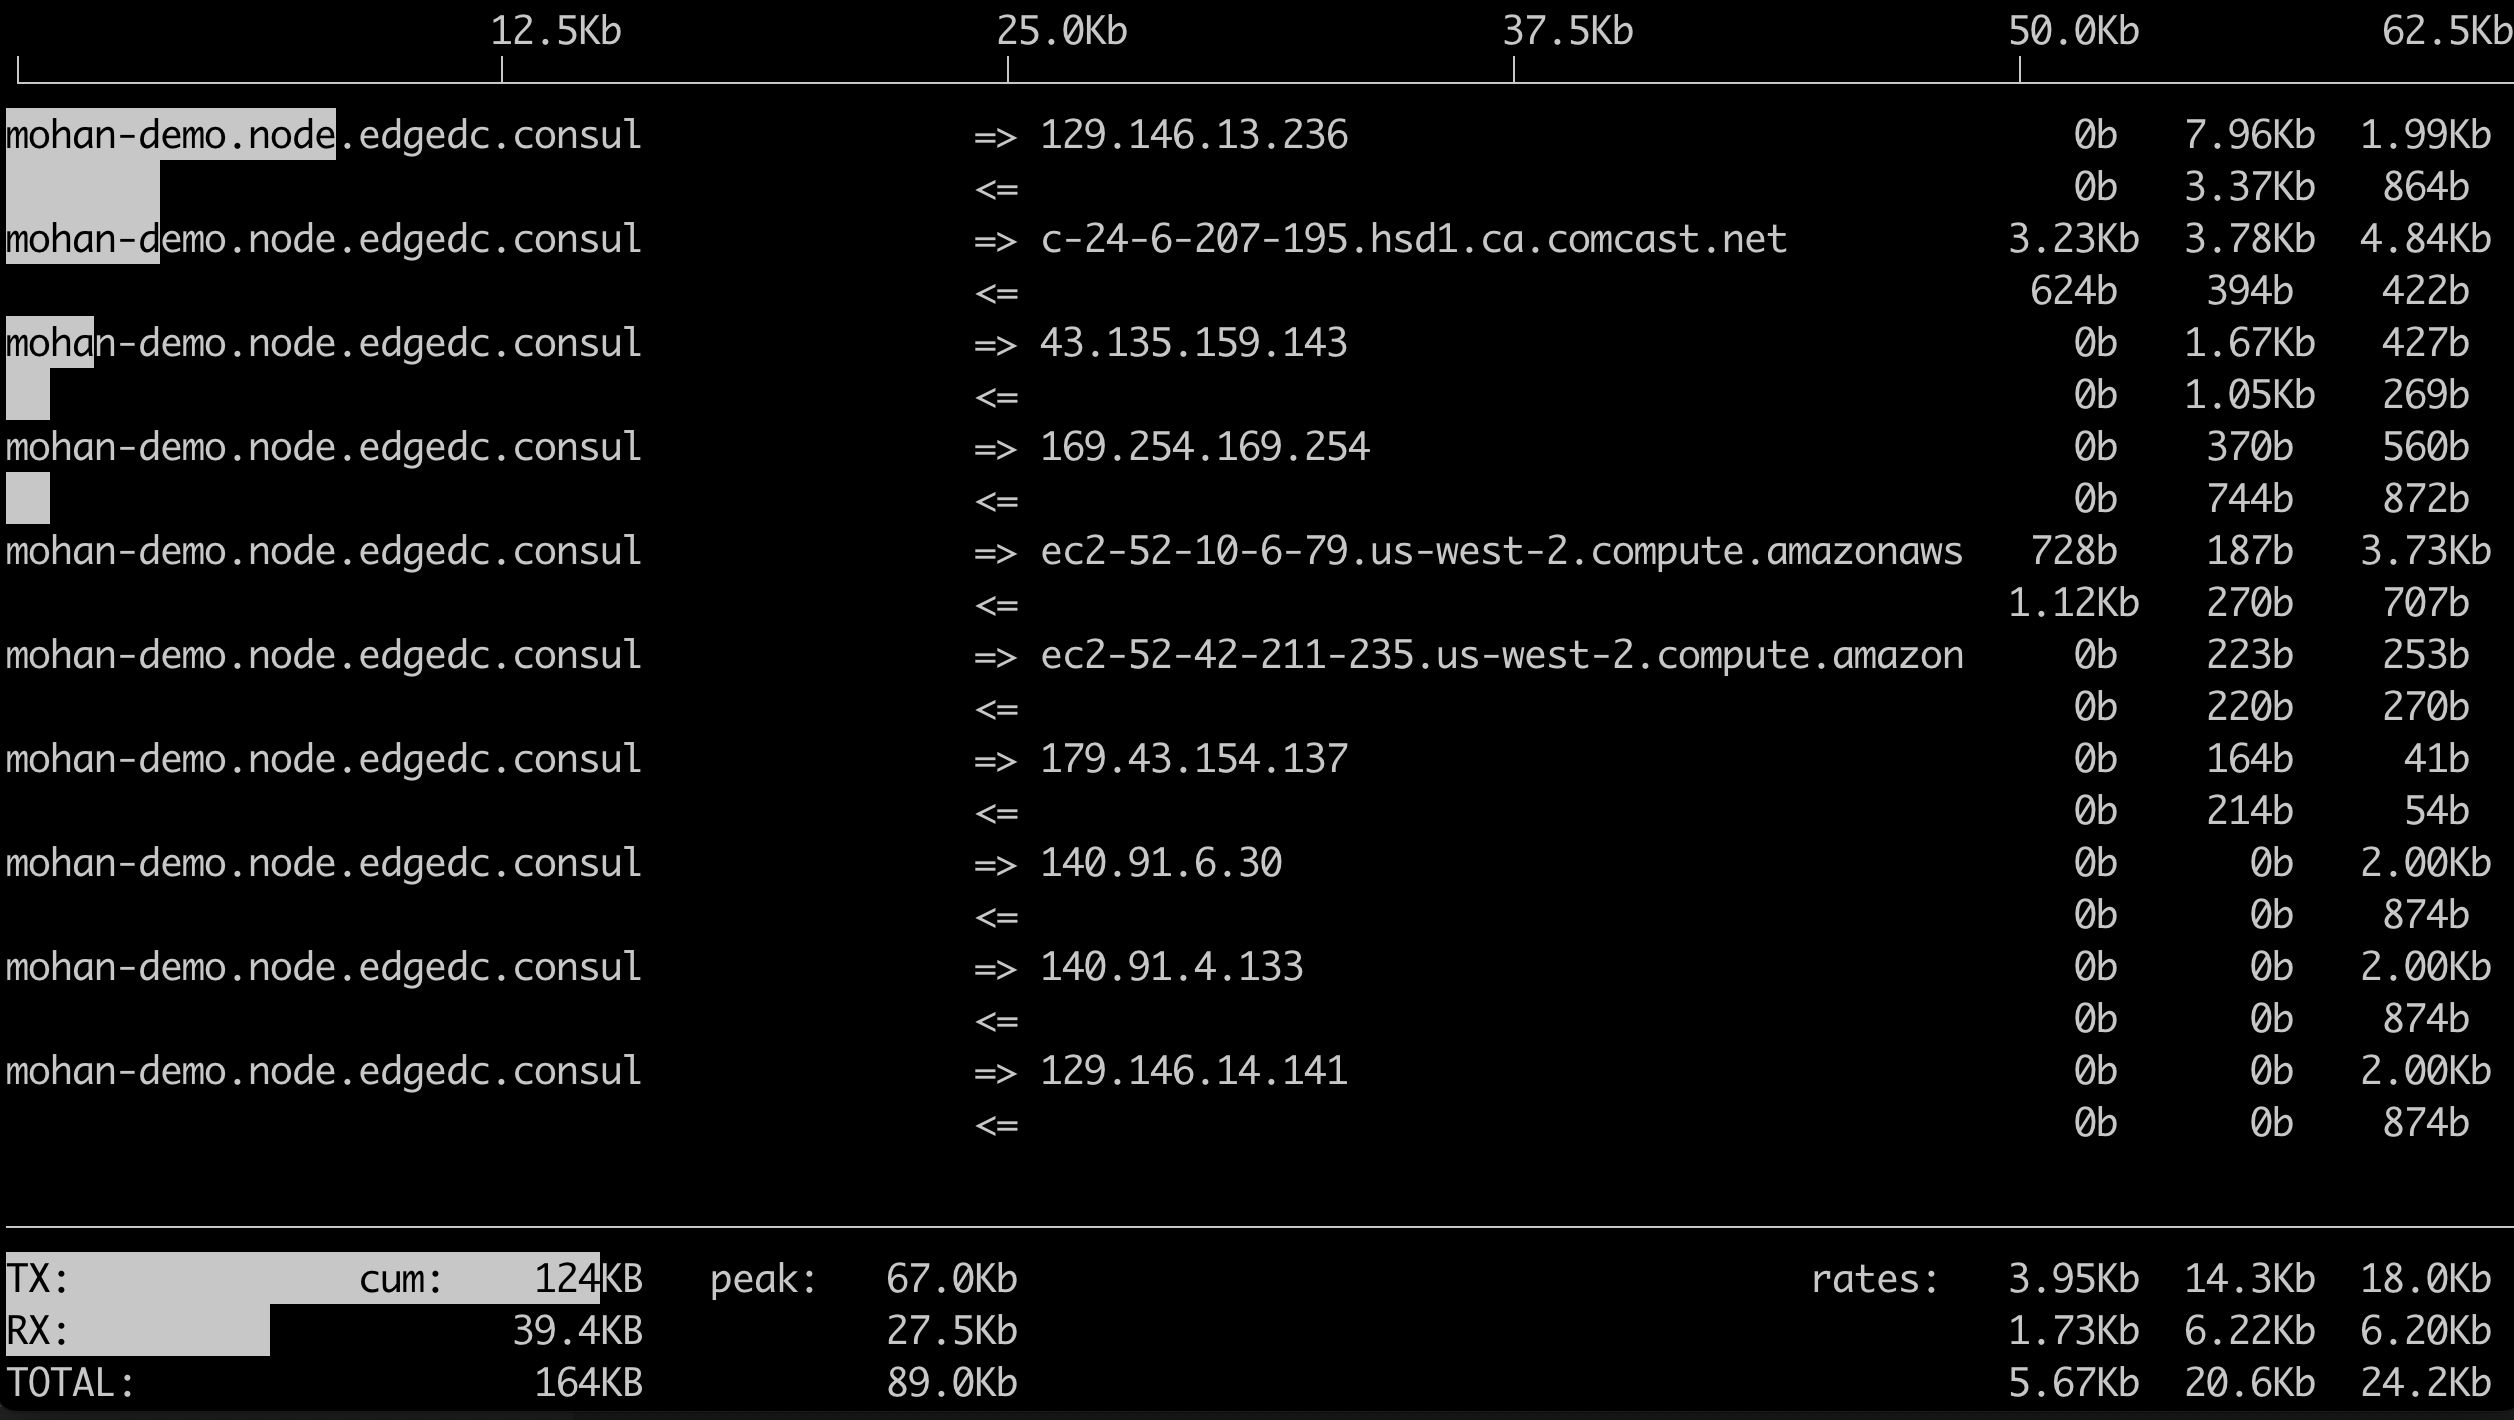
Test 3: Network Utilization
The Kubernetes management operator deployed on each managed cluster establishes and maintains a "hearbeat" with the controller. The cluster may also be required to perform DNS resolution etc consuming some network bandwidth in the process.
Admins that are interested in measuring this can use the "iftop" utility in Linux to measure the network bandwidth utilization.
sudo iftop
Important
You should see approx. 25 kpbs sustained bandwidth utilization
Here is an illustrative example of what you are expected to see
View Rules
Use the following command to view rules already configured
sudo tc qdisc show
An illustrative example of output you can expect to see is shown below.
qdisc noqueue 0: dev lo root refcnt 2
qdisc tbf 8002: dev ens3 root refcnt 3 rate 500Kbit burst 4Kb lat 400.0ms
Delete Rules
Use the following command to delete existing rules associated with the "ens3" interface.
sudo tc qdisc del dev ens3 root