Splunk
Important
This recipe is deprecated because Splunk Connect for Kubernetes will reach End of Support on January 1, 2024. After that date, this project will no longer receive updates from Splunk and will no longer be supported by Splunk. Until then, only critical security fixes and bug fixes will be provided.
Note
Splunk recommends migrating to Splunk OpenTelemetry Collector for Kubernetes. Please use this recipe instead.
Although the Kubernetes Management Operator on managed clusters provides integrated monitoring and visibility capabilities, organizations may have standardized on Splunk for their application log aggregation and/or cluster monitoring .
Splunk Connect for Kubernetes provides a way to import and search your Kubernetes logging, object, and metrics data into Splunk. This recipe describes how customers can standardize the configuration, deployment and lifecycle management of Splunk Connect across their fleet of clusters.
What Will You Do
In this exercise,
- You will create a customized "splunk-connect" addon using Splunk's "official Helm chart"
- You will use the addon in a custom cluster blueprint
- You will then apply this cluster blueprint to a managed cluster
Important
This recipe describes the steps to create and use a custom cluster blueprint using the Web Console. The entire workflow can also be fully automated and embedded into an automation pipeline.
Assumptions
- You have already provisioned or imported one or more Kubernetes clusters using the controller.
- You have access to a Splunk Server (Enterprise or Cloud)
Splunk Indexes
We will be using three (3) Splunk Indexes: - k8s-logs (for logs) - k8s-objects (for metadata) - k8s-metrics (for metrics)
Instructions to create Splunk Indexes
Splunk HEC
A valid HEC aka HTTP Event Collector token is required for Splunk Connect to send metrics and logs to your Splunk Server. Instructions to setup a HTTP Event Collector in Splunk.
Step 1: Download Helm Chart
Download the latest helm chart for Splunk Connect from the official repository. In this example, we will be using v1.4.3 of the chart (filename: splunk-connect-for-kubernetes-1.4.3.tgz).
wget https://github.com/splunk/splunk-connect-for-kubernetes/releases/download/1.4.3/splunk-connect-for-kubernetes-1.4.3.tgz
Step 2: Customize Values
The Splunk Connect Helm chart comes with a very complex values.yaml file with support for a large number of scenarios.
We will be customizing the default with our own override "values.yaml".
- Copy the details below into a file named "splunk-connect-custom-values.yaml".
- Replace the Splunk HEC settings with your Splunk server's values
# Custom values for Splunk Connect for Kubernetes Helm charts
global:
  splunk:
    hec:
      # Change to your splunk server hostname
      host: splunk-server.infra.gorafay.net
      # port to HEC, optional, default 8088
      port: 8088
      # Change to your splunk HEC token
      token: 12345678-1234-1234-1234-123456781234
      # protocol has two options: "http" and "https", default is "https"
      protocol: https
      # insecureSSL is a boolean, it indicates should it allow inscure SSL connection (when protocol is "https"). Default is false.
      insecureSSL: true
  kubernetes:
    # The cluster name used to tag logs.
    clusterName: "demo-cluster"
## Enabling splunk-kubernetes-logging will install the `splunk-kubernetes-logging` chart to a kubernetes
## cluster to collect logs generated in the cluster to a Splunk indexer/indexer cluster.
splunk-kubernetes-logging:
  enabled: true
  # Add additional pod labels for splunk-connect to collect your application logs from
  k8sMetadata:
    # Pod labels to collect
    podLabels:
      - app
      - k8s-app
      - release
      - app.kubernetes.io/name
      - rep-app
      - custom-app-label
  # = Configure Splunk HEC connection =
  splunk:
    hec:
      # Change to your application logs index name
      indexName: k8s-logs
# Enabling splunk-kubernetes-objects will install the `splunk-kubernetes-objects` chart to a kubernetes
## cluster to collect kubernetes objects in the cluster to a Splunk indexer/indexer cluster.
splunk-kubernetes-objects:
  enabled: true
  # = Configure Splunk HEC connection =
  splunk:
    hec:
      # Change to your object metadata index name
      indexName: k8s-objects
## Enabling splunk-kubernetes-metrics will install the `splunk-kubernetes-metrics` chart to a kubernetes
## cluster to collect metrics of the cluster to a Splunk indexer/indexer cluster.
splunk-kubernetes-metrics:
  enabled: true
  # = Splunk HEC Connection =
  splunk:
    hec:
      # Change to your metric index name
      indexName: k8s-metrics
Step 3: Create Addon
- Login into the Web Console and navigate to your Project as an Org Admin or Infrastructure Admin
- Under Infrastructure, select "Namespaces" and create a new namespace called "splunk-connect"
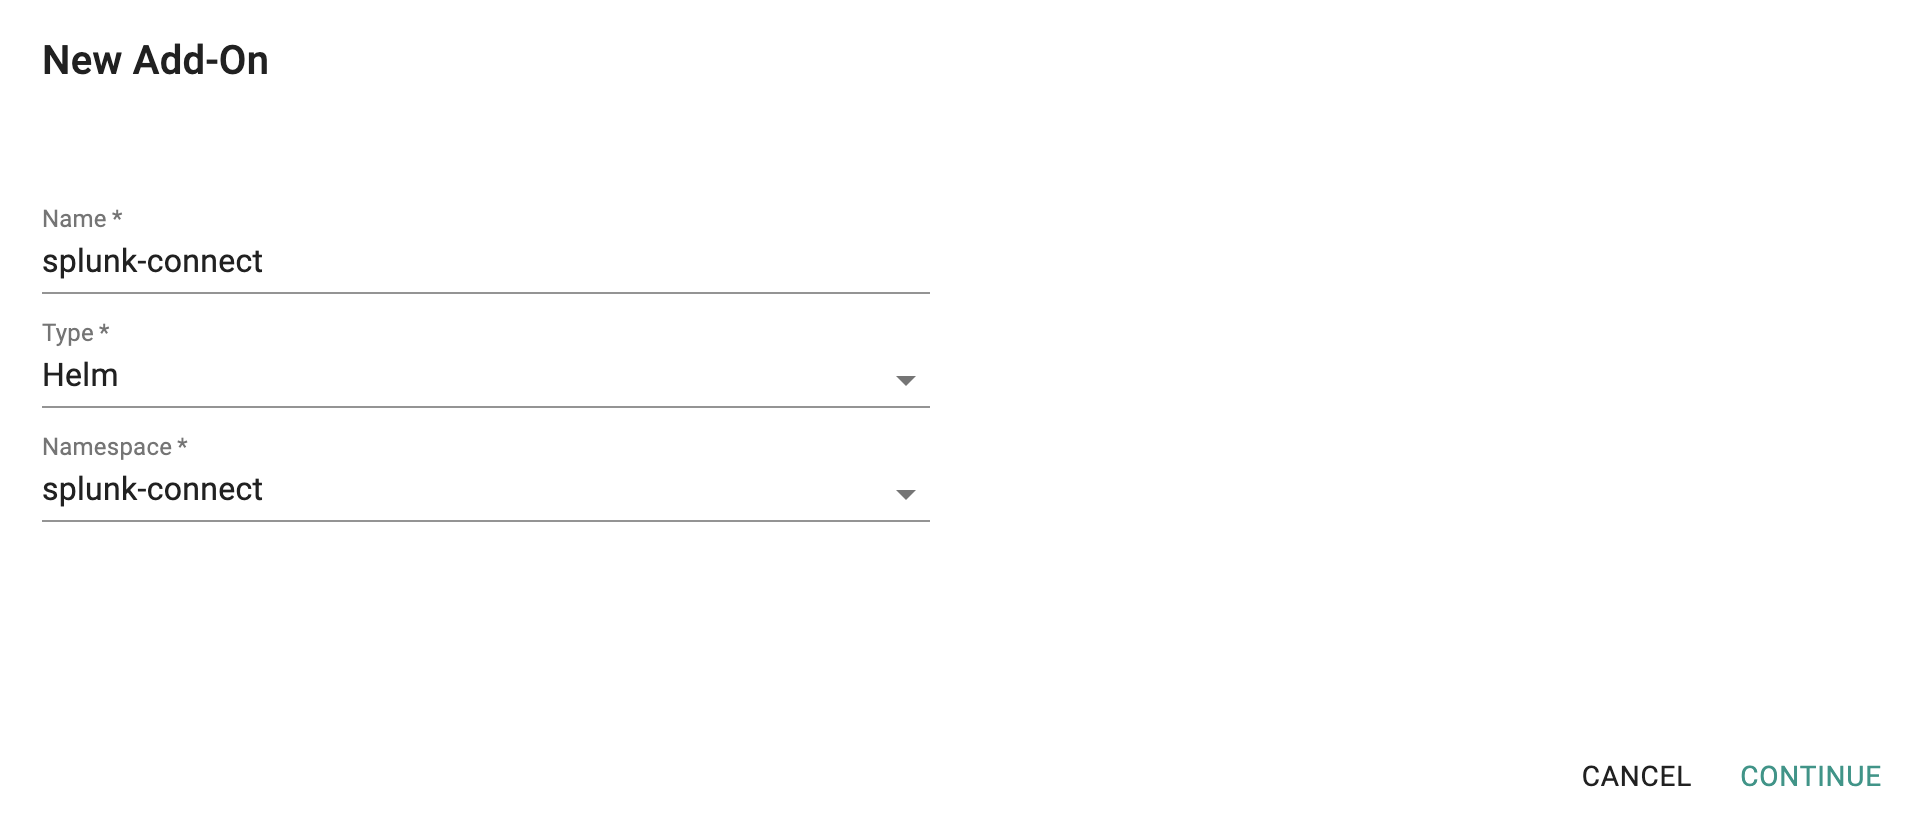
- Select "Addons" and "Create" a new Addon called "splunk-connect"
- Ensure that you select "Helm" for type and select the namespace as "splunk-connect"
- Upload the Helm chart "splunk-connect-for-kubernetes-1.4.3.tgz" from the previous step, the "splunk-connect-custom-values.yaml" file and Save
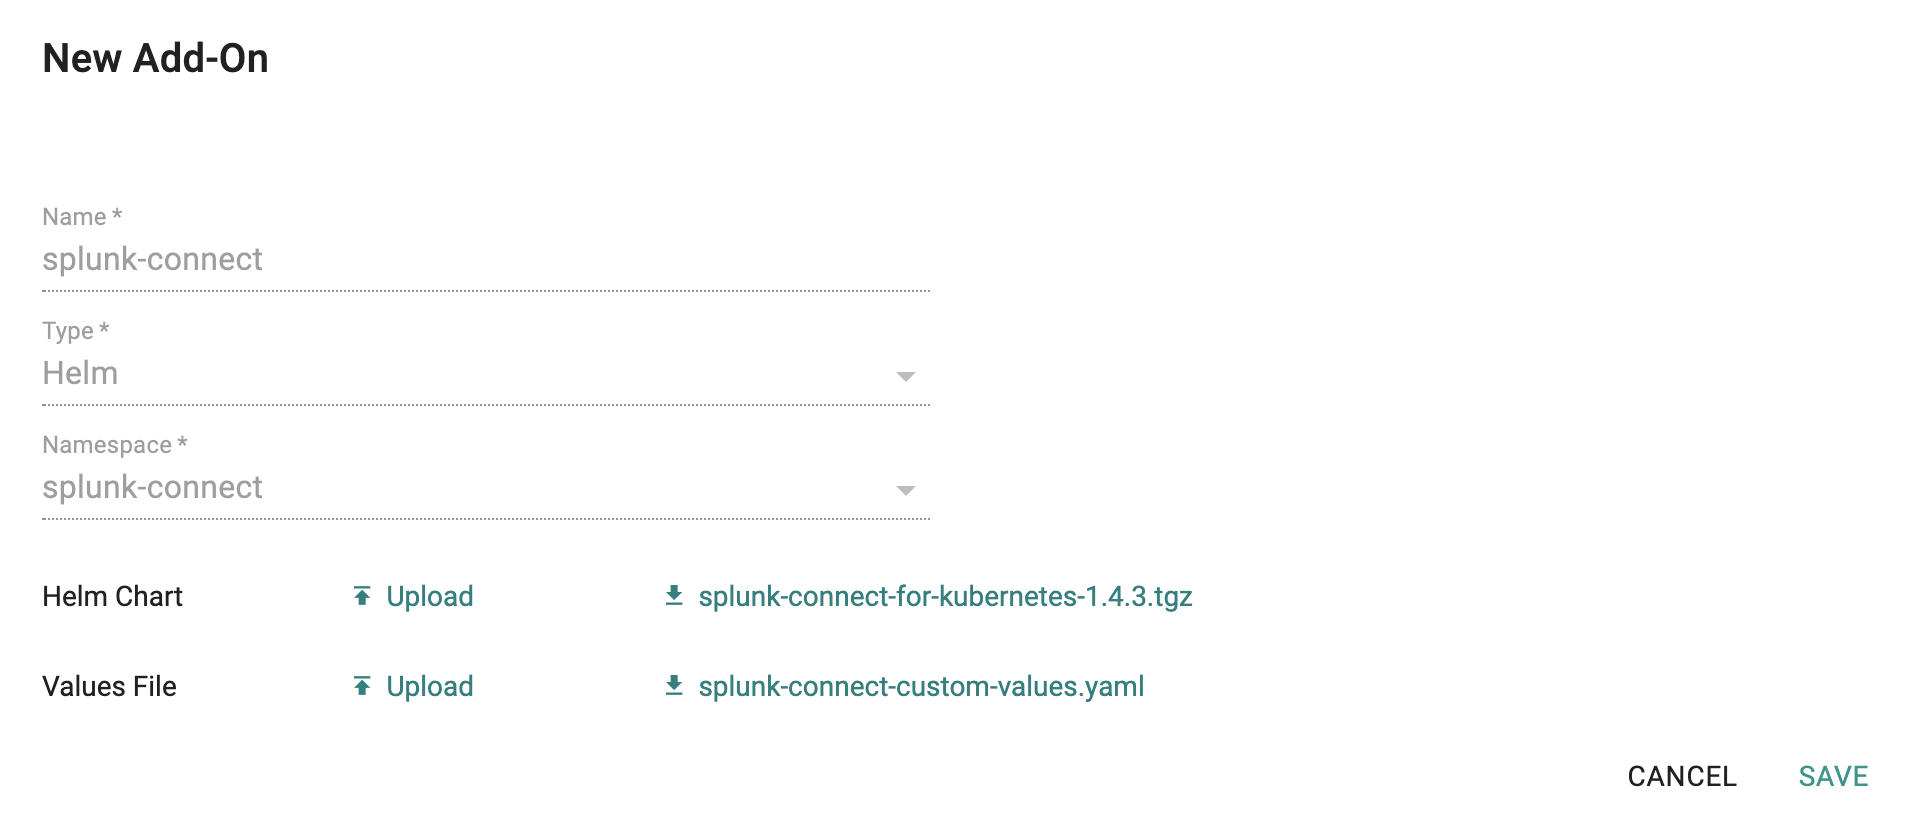
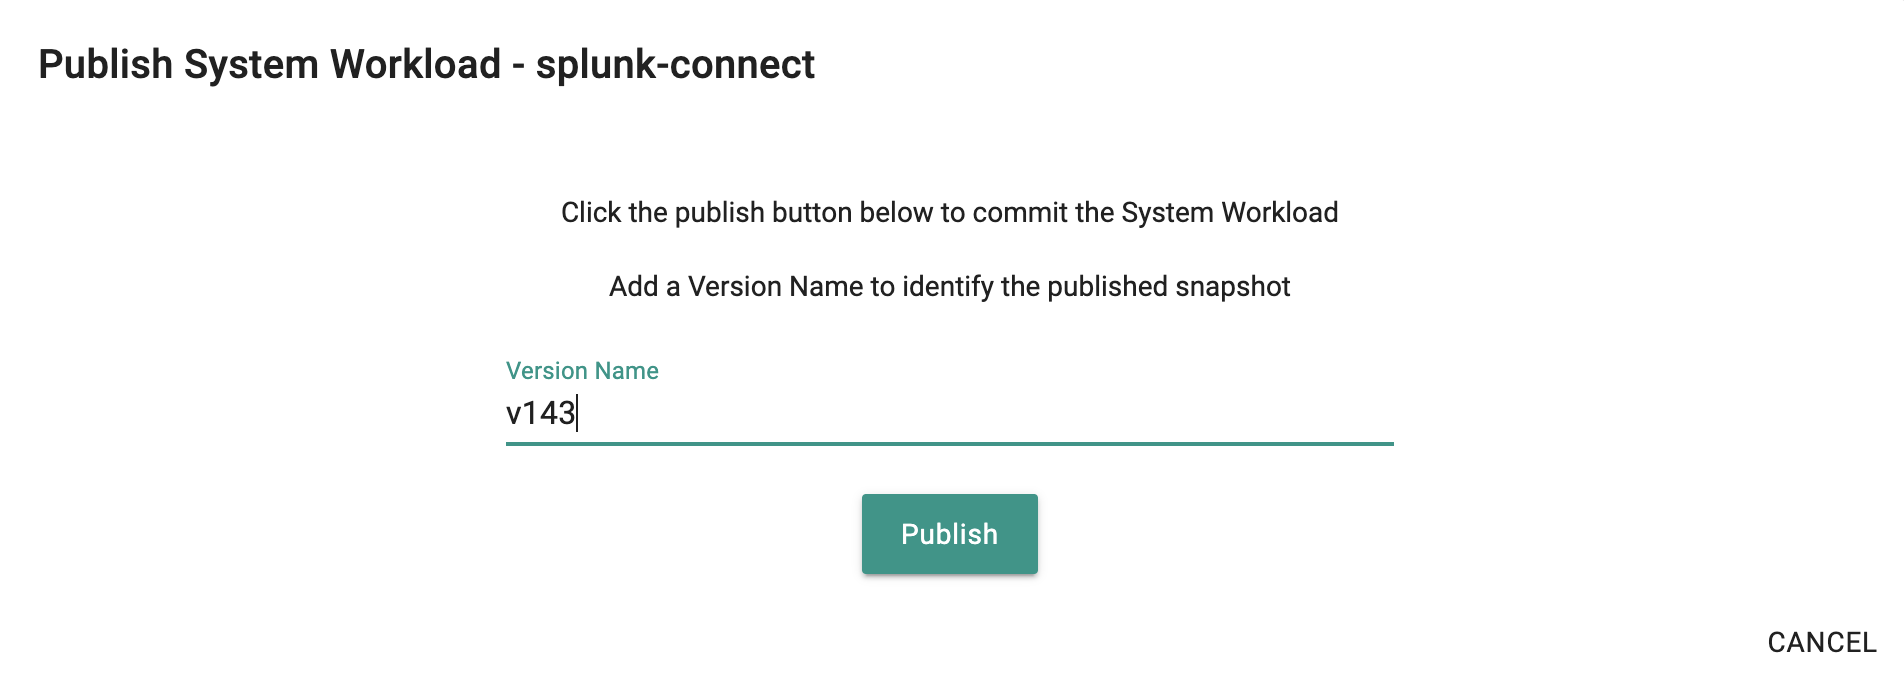
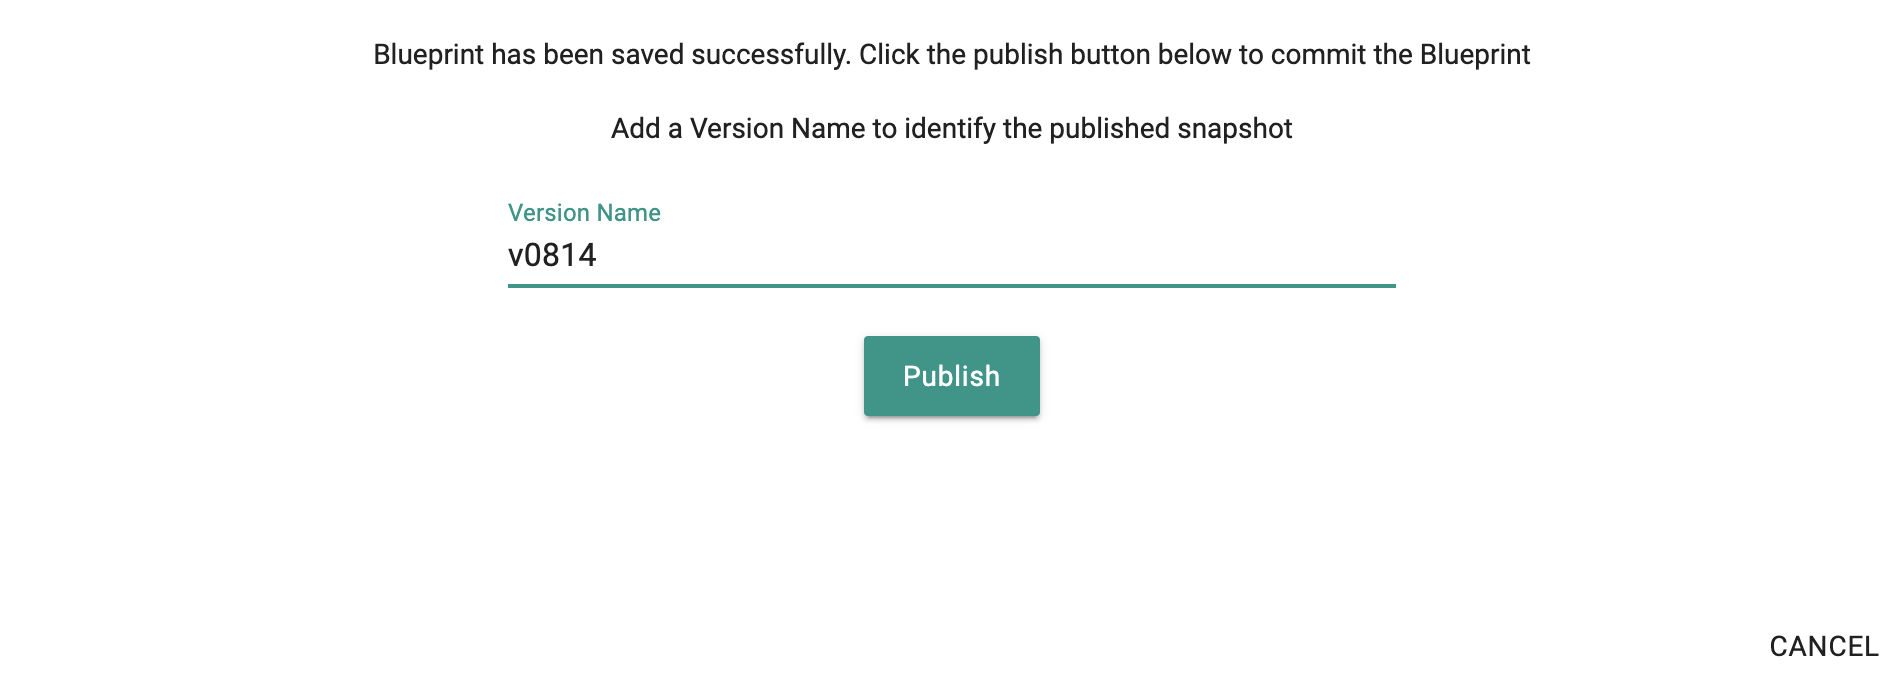
- Once the addon is created, publish it and optionally provide a version so that it can be tracked.
Step 4: Create Blueprint
Now, we are ready to assemble a custom cluster blueprint using the newly created Splunk addon. We can add additional addons to the blueprint at the same time. In this example, we are also including the "cert-manager" addon to our blueprint
- Under Infrastructure, select "Blueprints"
- Create a new blueprint and give it a name such as "standard-blueprint"
- Ensure that you have managed Ingress enabled
- Select the splunk-connect and cert-manager addons
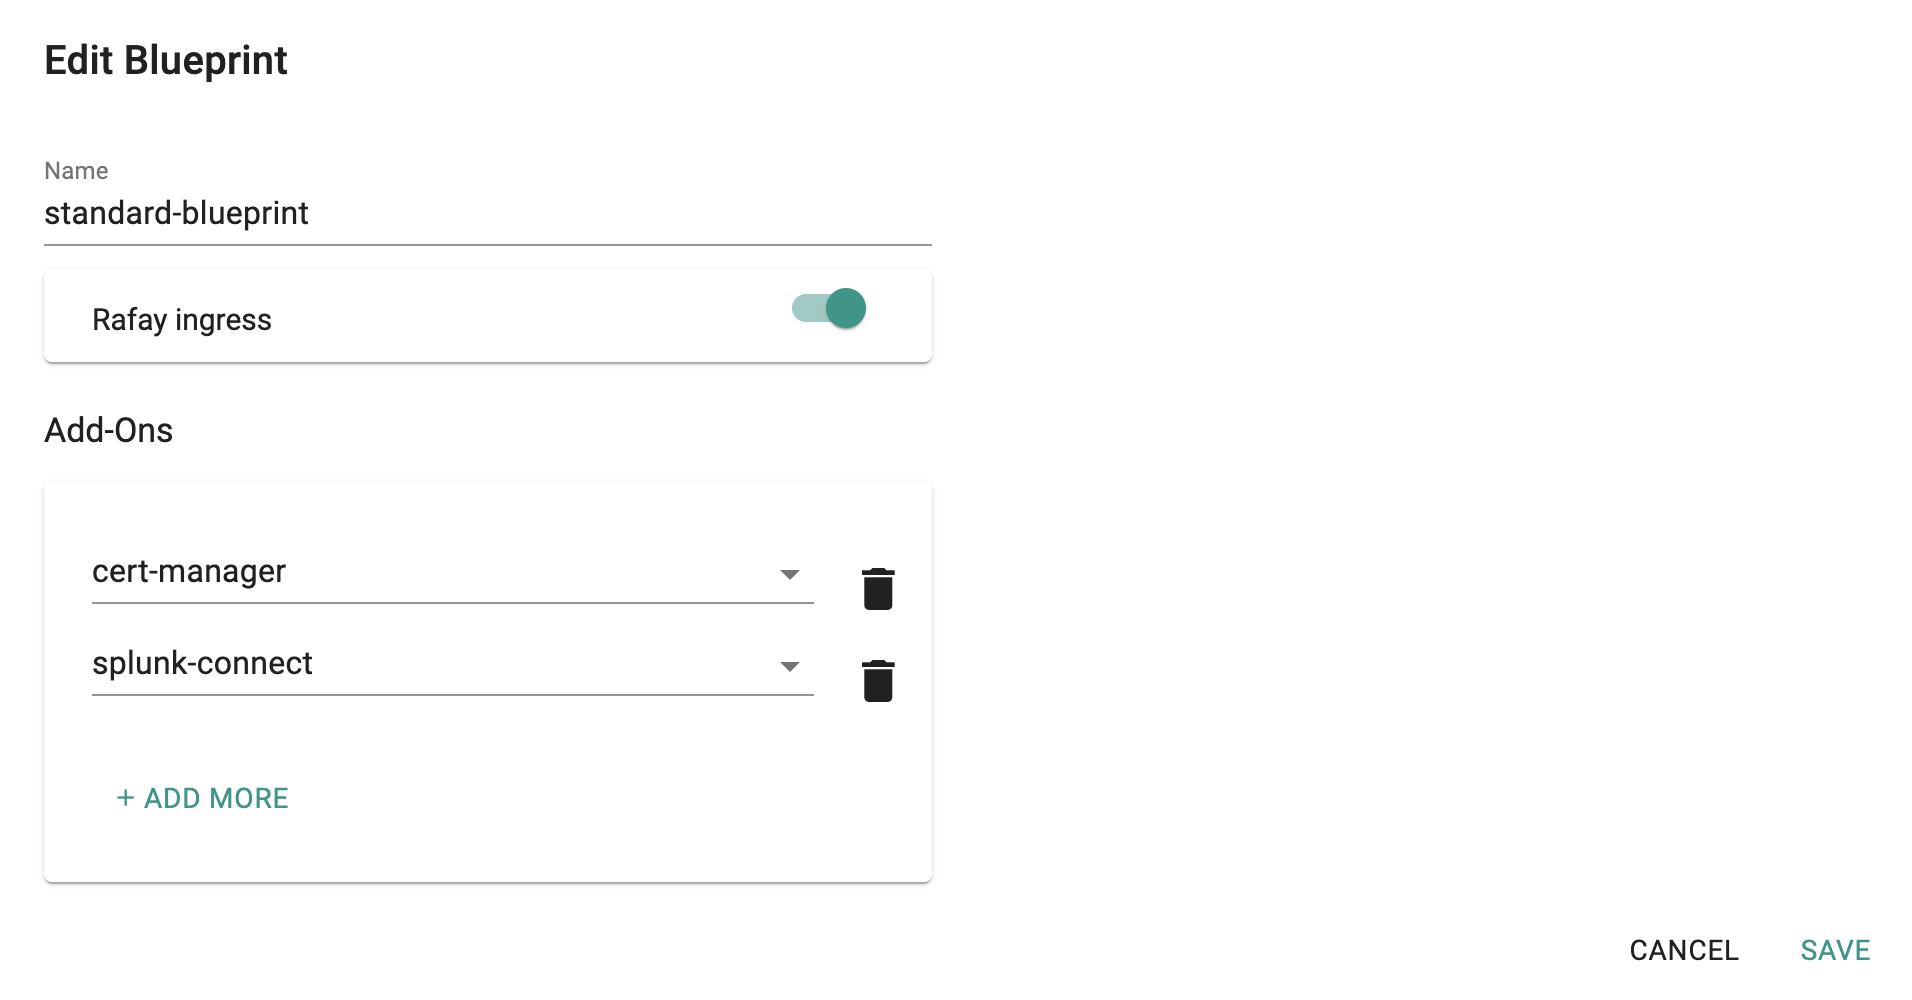
- Once the blueprint is created, publish it and optionally provide a version so that it can be tracked.
Step 5: Apply Blueprint
Now, we are ready to apply this custom blueprint to a cluster.
- Click on Options for the target Cluster in the Web Console
- Select "Update Blueprint" and select the "standard-blueprint" blueprint we created from the list
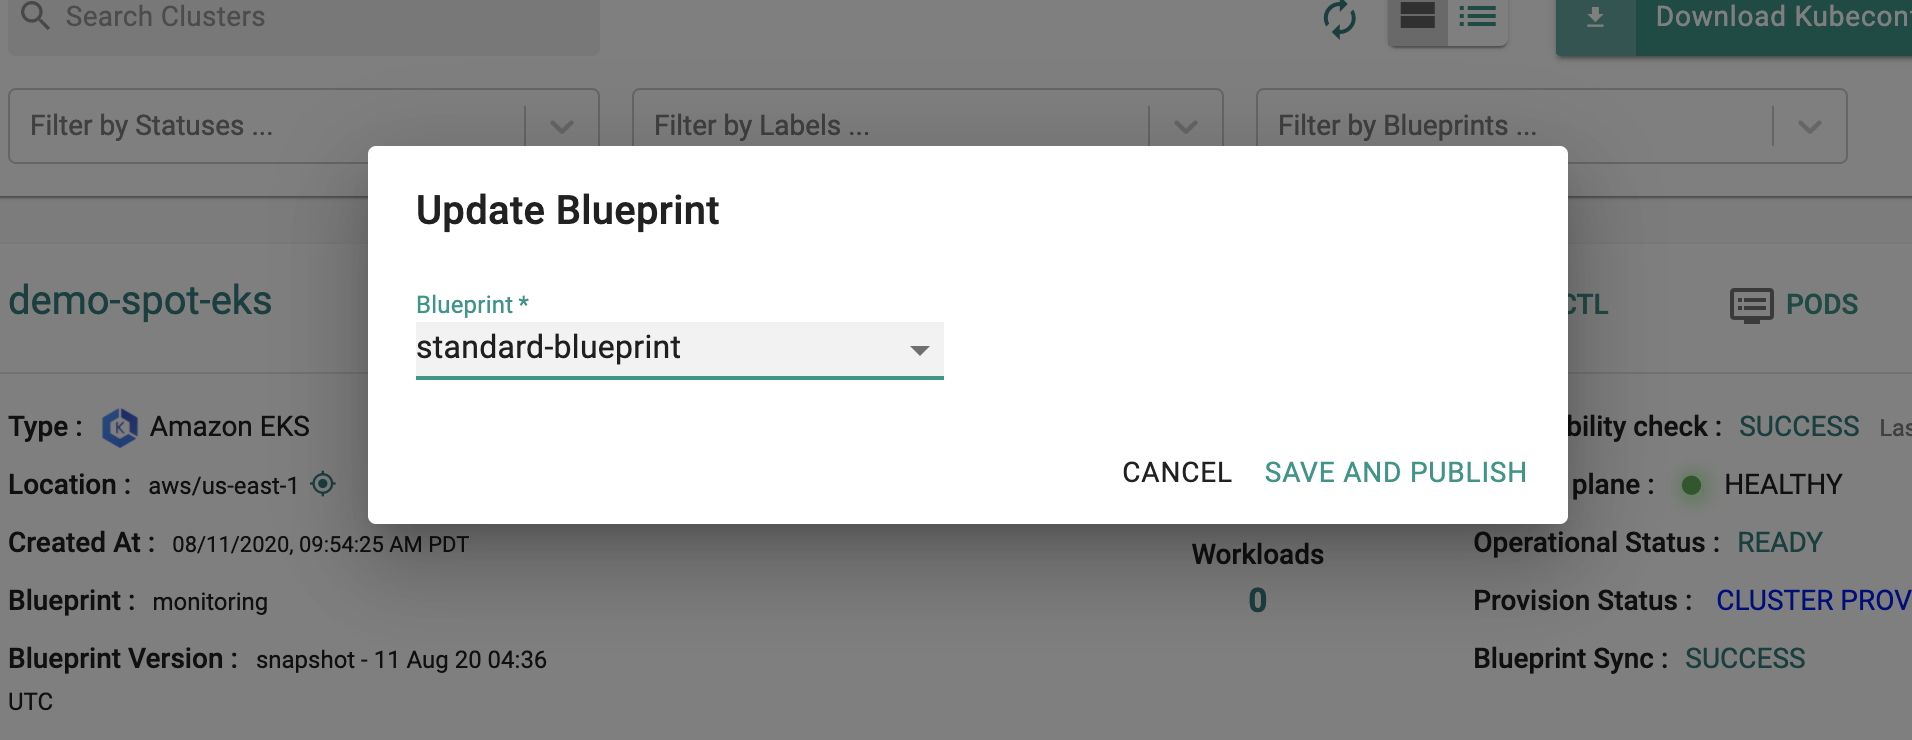
- Click on "Save and Publish".
This will start the deployment of the addons configured in the "standard-blueprint" blueprint to the targeted cluster. The blueprint sync process can take a few minutes. Once complete, the cluster will display the current cluster blueprint details and whether the sync was successful or not.
Step 6: Verify Blueprint
Users can optionally verify whether the required resources for the custom blueprint were created on the cluster. Click on the Kubectl button on the cluster to open a virtual terminal
First, we will verify if the "splunk-connect" namespace has been created
kubectl get ns splunk-connect

NAME             STATUS   AGE
splunk-connect   Active   6m17s
Next, we will verify that the required pods were created in the "splunk-connect" namespace. You should see something like the example below.
kubectl get pod -n splunk-connect

NAME                                                              READY   STATUS    RESTARTS   AGE
splunk-connect-v143-splunk-kubernetes-logging-rvbvh               1/1     Running   0          6m39s
splunk-connect-v143-splunk-kubernetes-logging-z5qns               1/1     Running   0          6m39s
splunk-connect-v143-splunk-kubernetes-metrics-4r8mx               1/1     Running   0          6m39s
splunk-connect-v143-splunk-kubernetes-metrics-agg-68c665dcxzzk7   1/1     Running   0          6m39s
splunk-connect-v143-splunk-kubernetes-metrics-s6mrp               1/1     Running   0          6m39s
splunk-connect-v143-splunk-kubernetes-objects-7d659ddfd8-682td    1/1     Running   0          6m39s
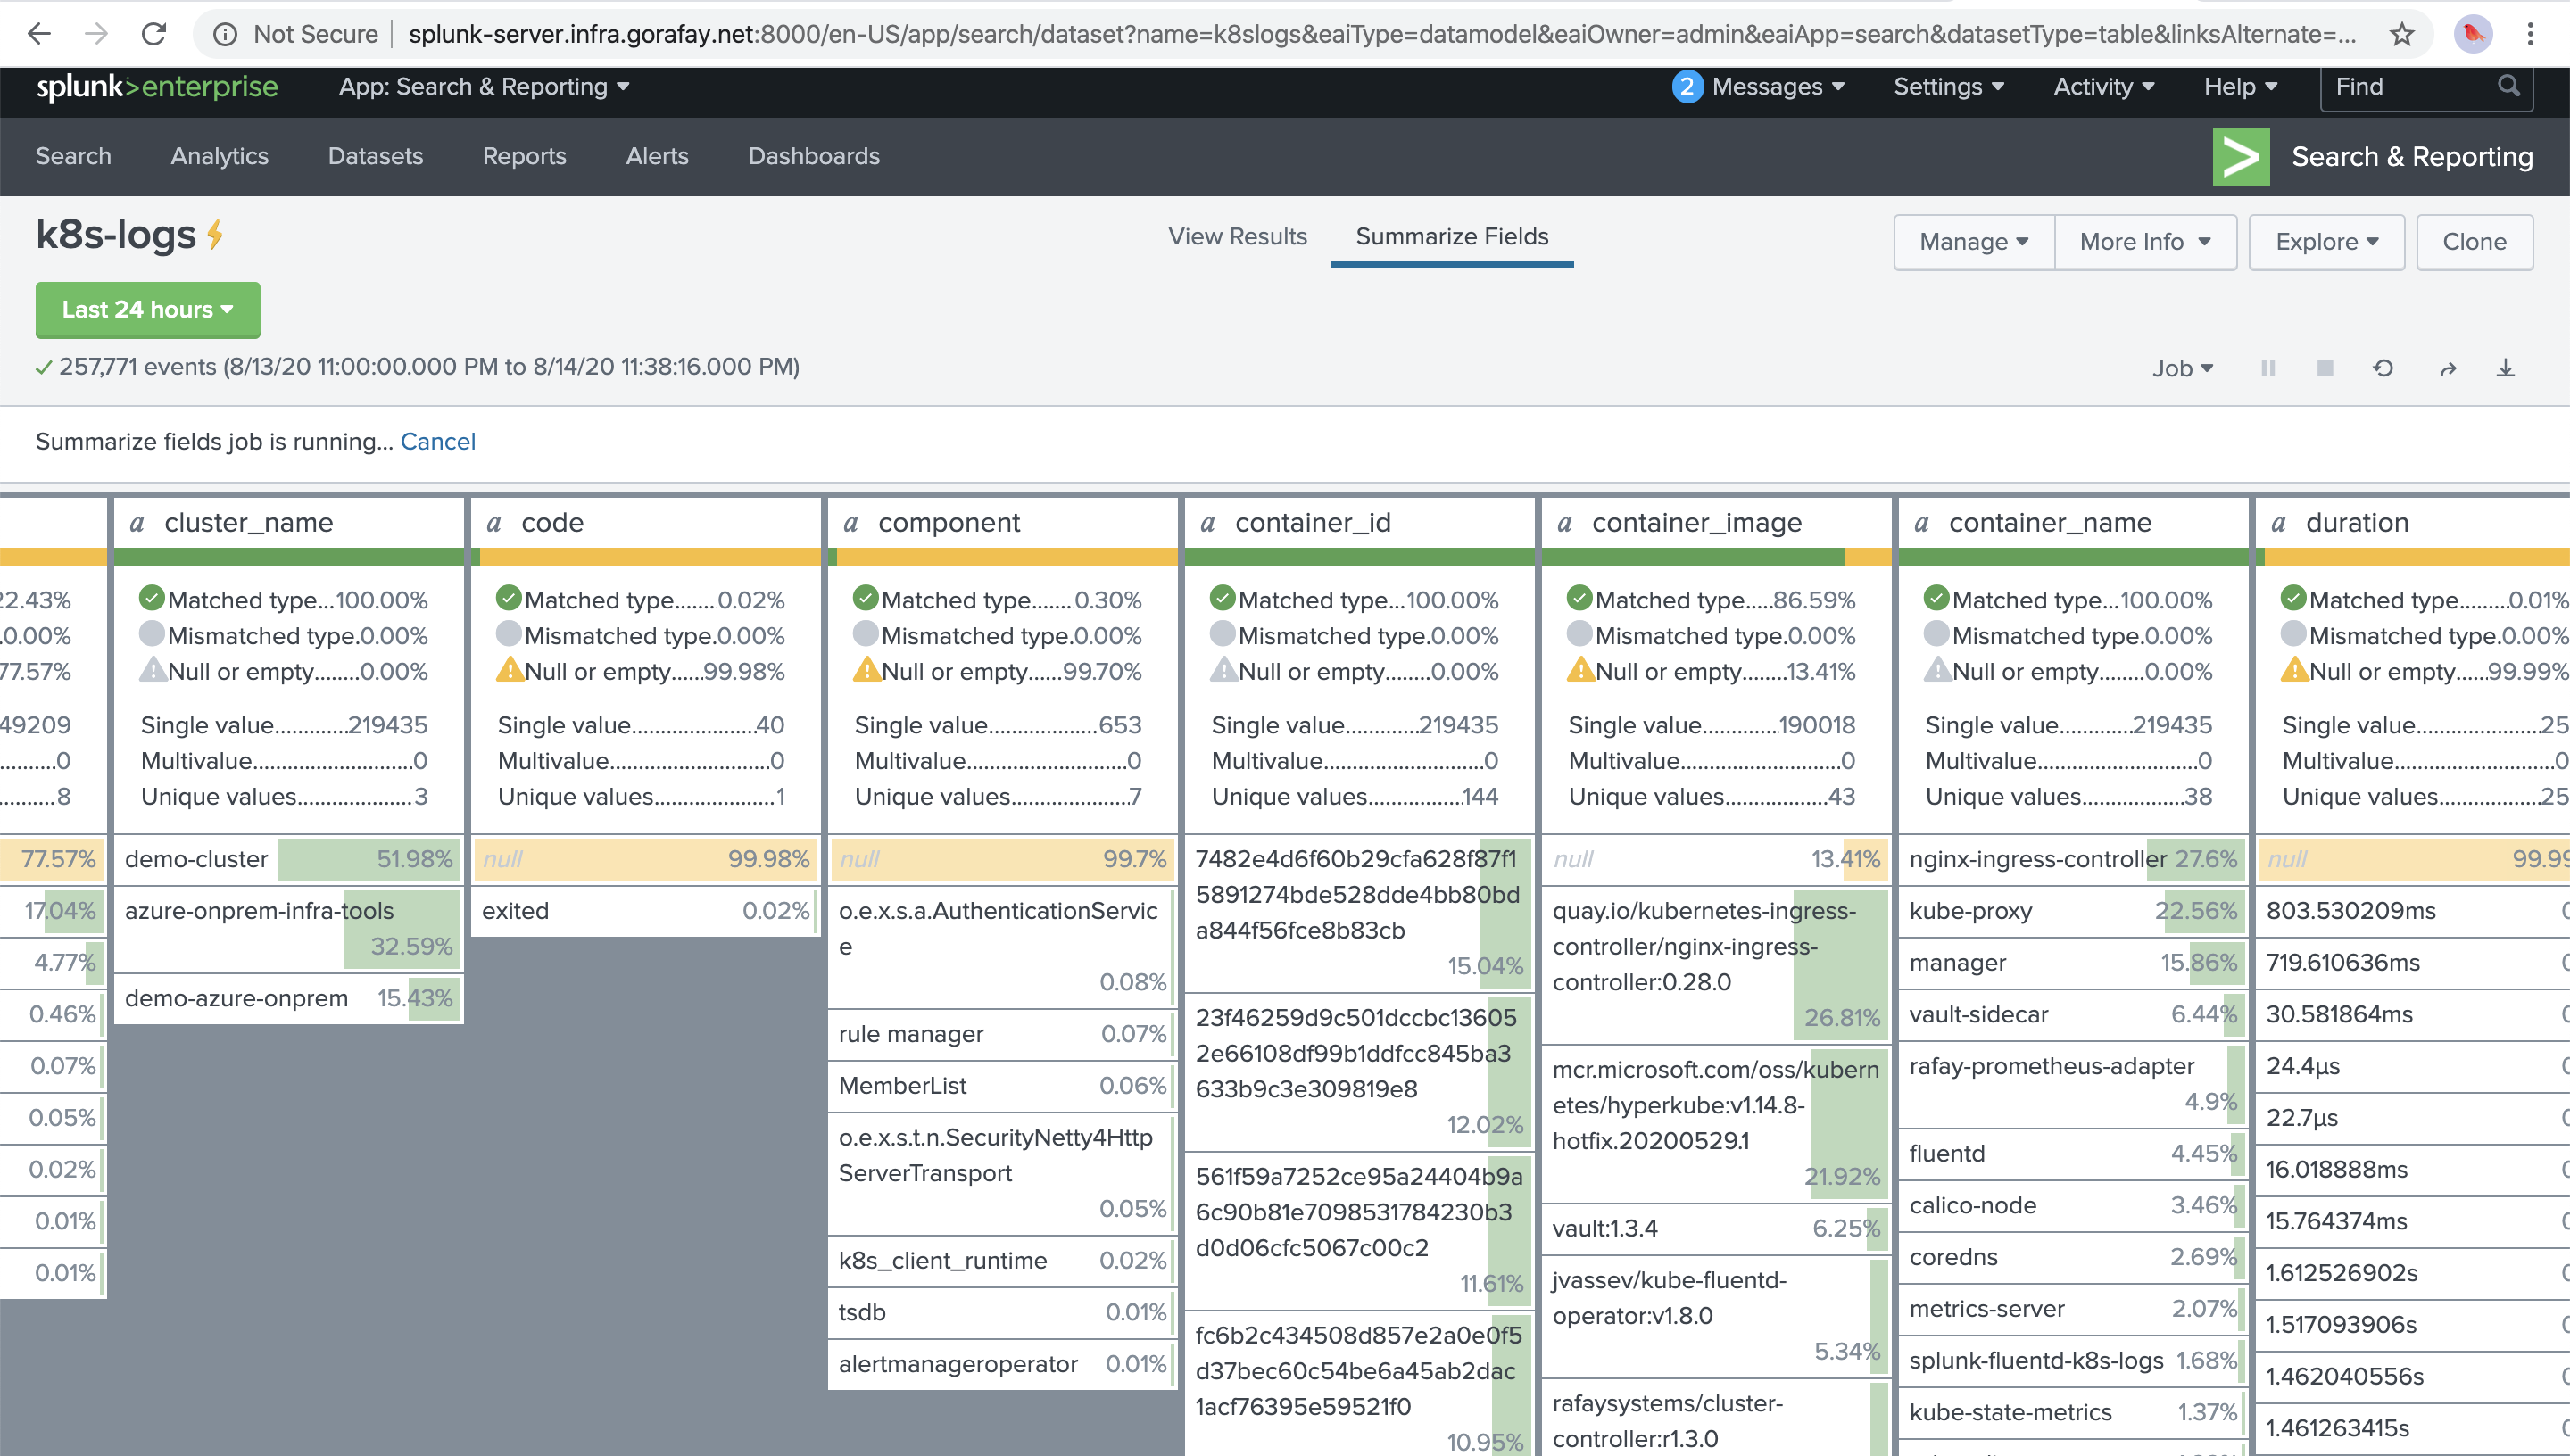
Step 7: View Data in Splunk
Now, we will access our Splunk server to view the logs and metrics data collected from the cluster. Shown below is an illustrative example of the summary view of all your application logs collected by splunk-connect from your Splunk server.
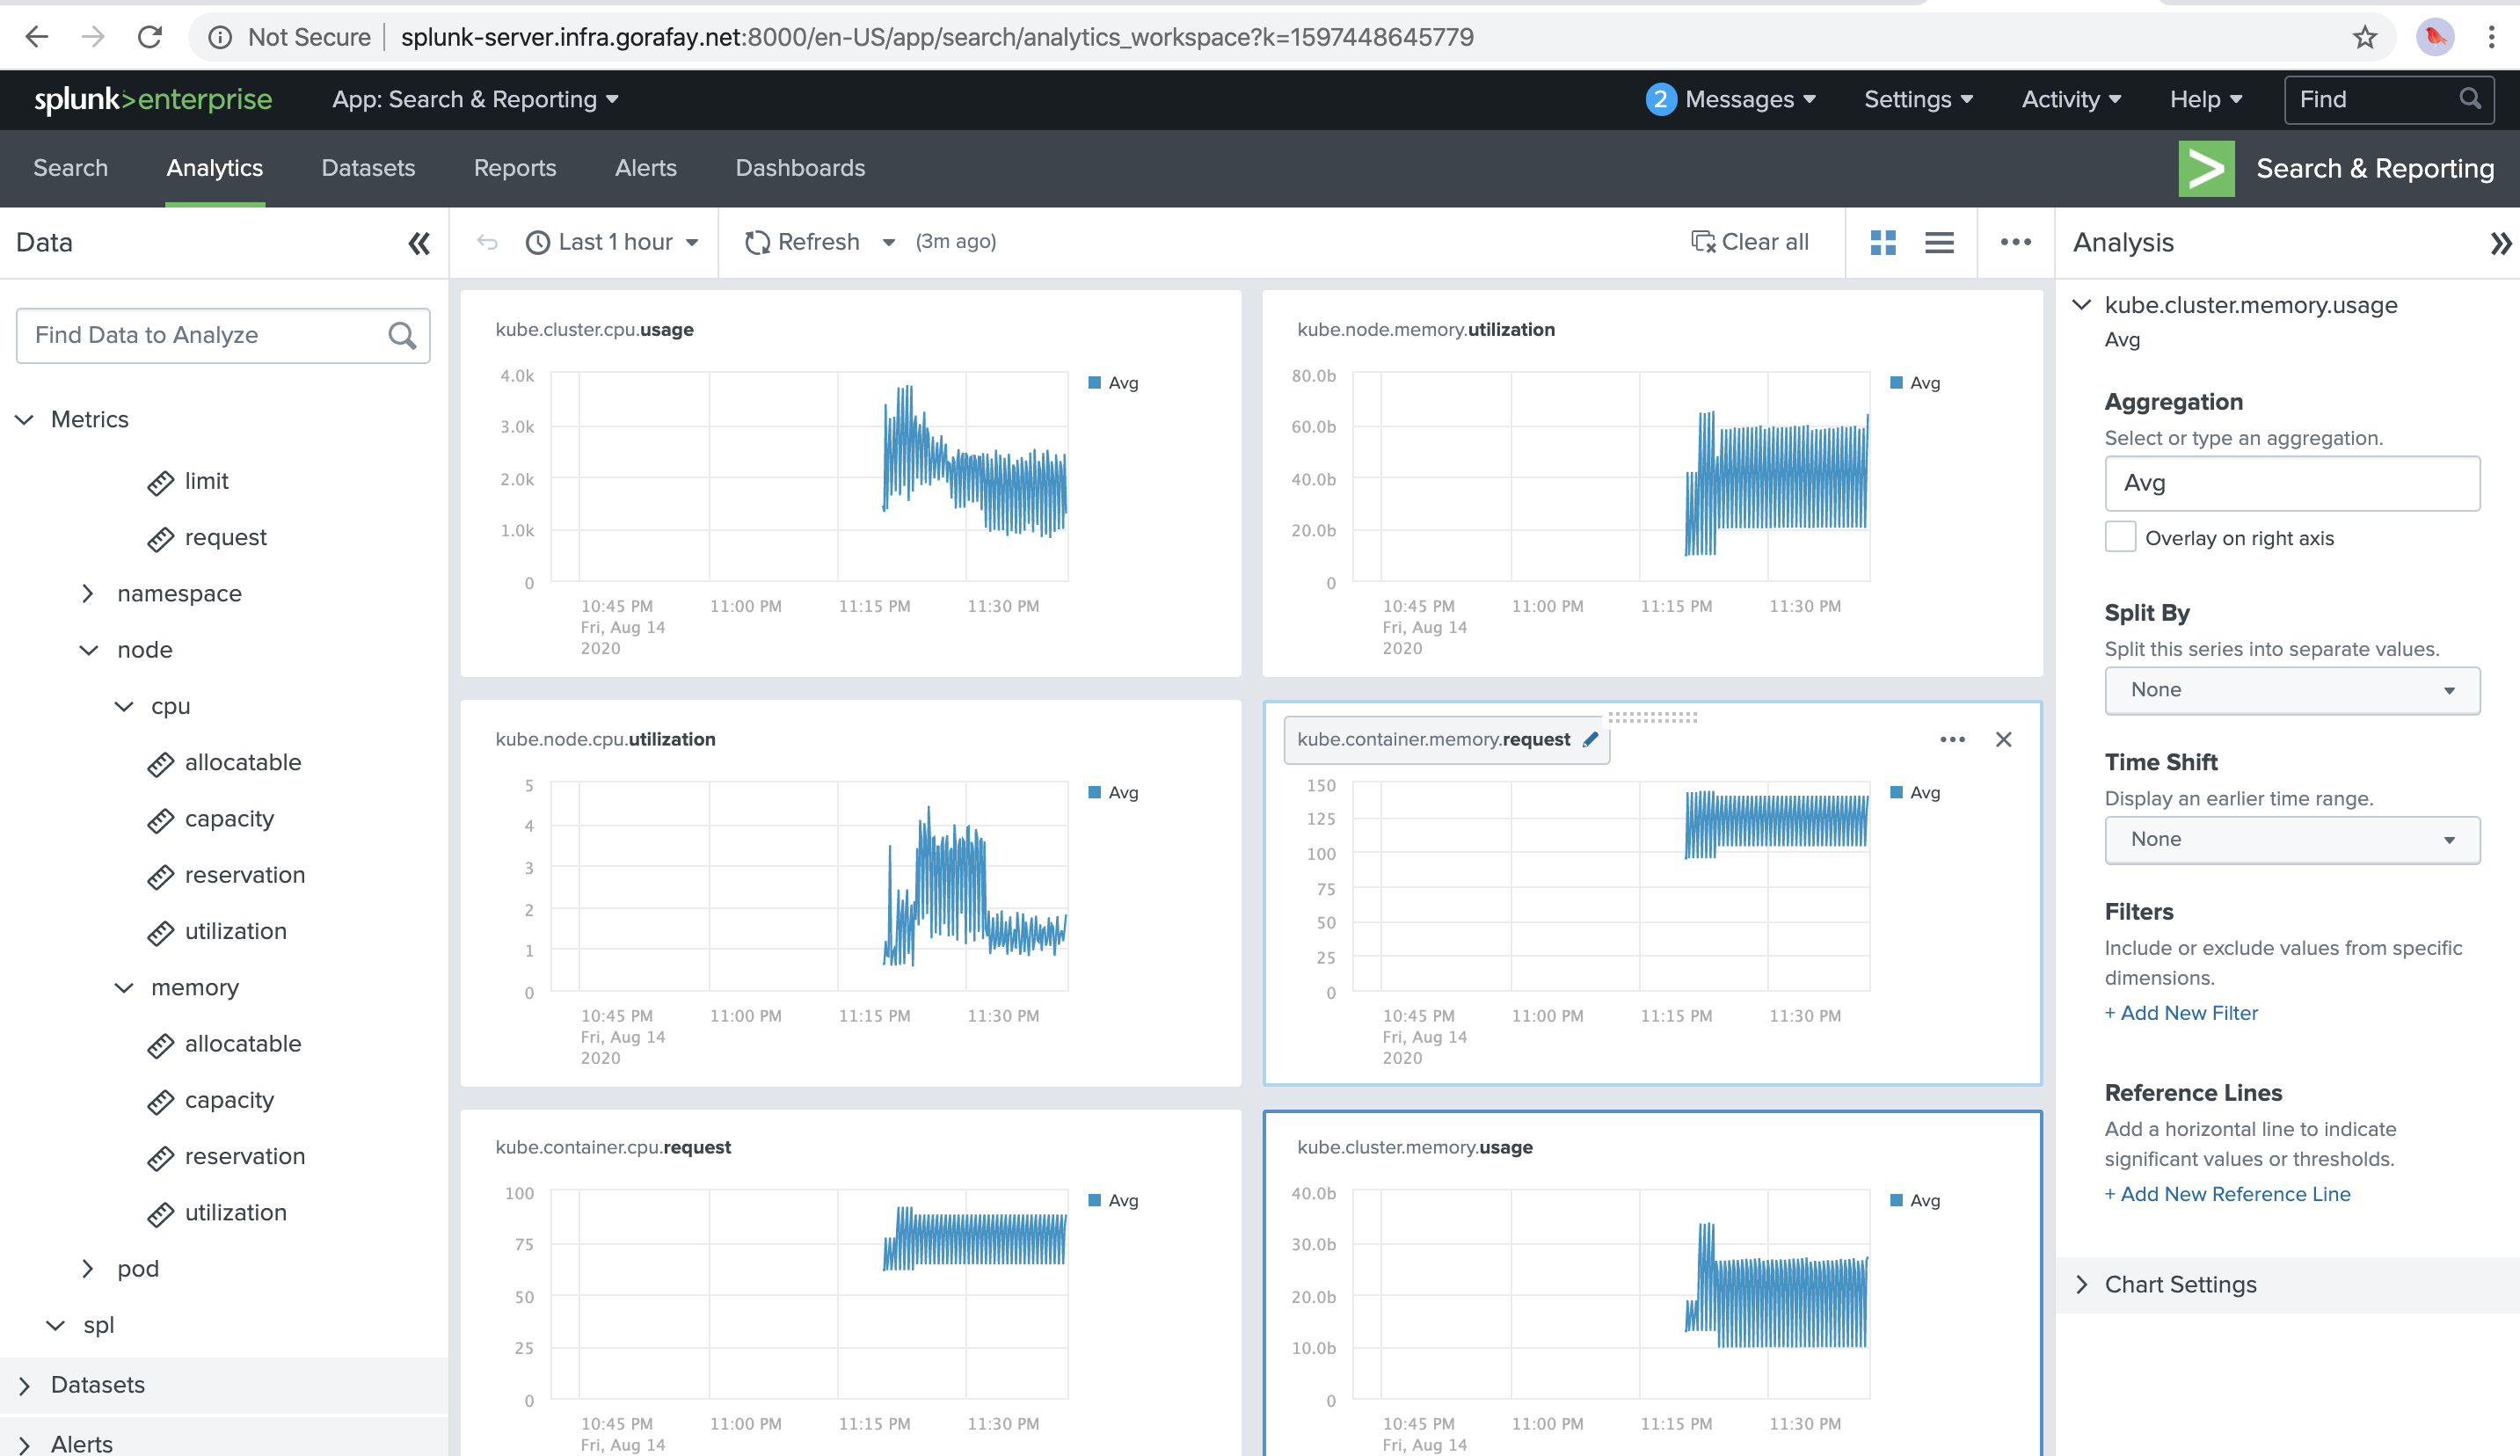
And below is another illustrative example for the metrics dashboard powered by the cluster metrics collected by splunk-connect.
Recap
Congratulations! You have successfully created a custom cluster blueprint with the "splunk-connect" and "cert-manager" addons and applied to a cluster. You can now use this blueprint on as many clusters as you require.