Prometheus Operator
Although the Kubernetes Management Operator on managed clusters provides integrated monitoring and visibility capabilities, organizations may prefer to deploy and operate their own "custom monitoring" stack.
Prometheus Operator provides a Kubernetes native deployment and management of Prometheus and related monitoring components. It uses Kubernetes custom resources to simplify and streamline the deployment and configuration of Prometheus, Alert Manager, and associated components. Specifically, it allows users to define and manage monitoring instances as Kubernetes resources.
This recipe describes how customers can standardize the configuration, deployment and lifecycle management of Prometheus Operator based cluster monitoring stack across their fleet of clusters.
Important
The managed Prometheus monitoring components are tuned and optimized to ensure that they will NOT collide with a customer's Prometheus Operator deployment on managed clusters.
What Will You Do
In this exercise,
- You will create a customized "Prometheus Operator" addon using a recent "official Helm chart"
- You will use the addon in a custom cluster blueprint
- You will then apply this cluster blueprint to a managed cluster
Important
This tutorial describes the steps to create and use a custom cluster blueprint using the Web Console. The entire workflow can also be fully automated and embedded into an automation pipeline.
Assumptions
- You have already provisioned or imported one or more Kubernetes clusters using the controller.
- You have Helm CLI installed locally to download required Helm charts
Challenges
Although deploying a simple Helm chart can be trivial for a quick sniff test, there are a number of considerations that have to be factored in for a stable, secure deployment. Some of them are described below.
Ingress
The Grafana service deployed on the cluster needs to be exposed externally for it to be practical. In this recipe, we will use managed nginx Ingress Controller in the default blueprint to expose the Grafana service externally.
Certificate Lifecycle
Access to Ingress needs to be secured using TLS. It is impractical to manually handle certificates and private keys. In this recipe, we will use a managed cert-manager addon in our cluster blueprint to manage the lifecycle of certificates for the Vault Server's Ingress.
Step 1: Download Helm Chart
- We will be using the Prometheus Operator helm chart from the official repository. Add the official helm repo to your Helm CLI if you haven't already added it.
helm repo add stable https://kubernetes-charts.storage.googleapis.com
- Download the Prometheus Operator Helm chart. In this example, we will be using v9.3.1 of the chart (filename: prometheus-operator-9.3.1.tgz).
helm pull stable/prometheus-operator
Step 2: Customize Values
The Prometheus Operator Helm chart comes with a very complex values.yaml file with support for a large number of scenarios. We will be customizing the default with our own override "values.yaml"
Copy the details below into a file named "prom-values.yaml".
- We only care about k8s versions 1.15 and higher
- We want to retain metrics for 7 days and a maximum of 10GB
- We do not want to use the default Grafana dashboards
- The Grafana dashboard will be accessible at "https://grafana.infra.gorafay.net" and will be secured using a Let's Encrypt issued certificate
## We only care about values from k8s v1.15 and higher
#
kubeTargetVersionOverride: "1.15.12"

## Retain data for 7 days with max local storage of 10GB backed by a PVC
#
prometheus:
  prometheusSpec:
    retention: 7d
    retentionsize: 10G
  storageSpec:
    volumeClaimTemplate:
      spec:
        storage: 10Gi

## Do not use default dashboards. Specify the ones that are actually useful
## Add the required annotations for Ingress and Cert-Manager
#
grafana:
  defaultDashboardsEnabled: false
  adminPassword: "Password!23!"
  dashboards:
    default:
      kubernetes-cluster:
        gnetId: 12206
        datasource: Prometheus
      kubernetes-nodes:
        gnetId: 12133
        datasource: Prometheus
      kubernetes-pods:
        gnetId: 12128
        datasource: Prometheus
      kubernetes-node-exporter:
        gnetId: 12132
        datasource: Prometheus
      kubernetes-compute-namespace-pods:
        gnetId: 12117
        datasource: Prometheus
      kubernetes-api-server:
        gnetId: 12116
        datasource: Prometheus
      kubernetes-kubelet:
        gnetId: 12123
        datasource: Prometheus
      kubernetes-compute-cluster:
        gnetId: 12114
        datasource: Prometheus
  dashboardProviders:
    dashboardproviders.yaml:
      apiVersion: 1
      providers:
        - name: default
          orgId: 1
          folder:
          type: file
          disableDeletion: true
          editable: false
          options:
            path: /var/lib/grafana/dashboards/default
  ingress:
    enabled: true
    annotations:
      kubernetes.io/ingress.class: nginx
      cert-manager.io/cluster-issuer: "letsencrypt-http"
    hosts:
       - grafana.infra.gorafay.net
    path: /
    tls:
    - secretName: grafana-dev-tls
      hosts:
       - grafana.infra.gorafay.net
Step 3: Create Addon
- Login into the Web Console and navigate to your Project as an Org Admin or Infrastructure Admin
- Under Infrastructure, select "Namespaces" and create a new namespace called "prometheus"
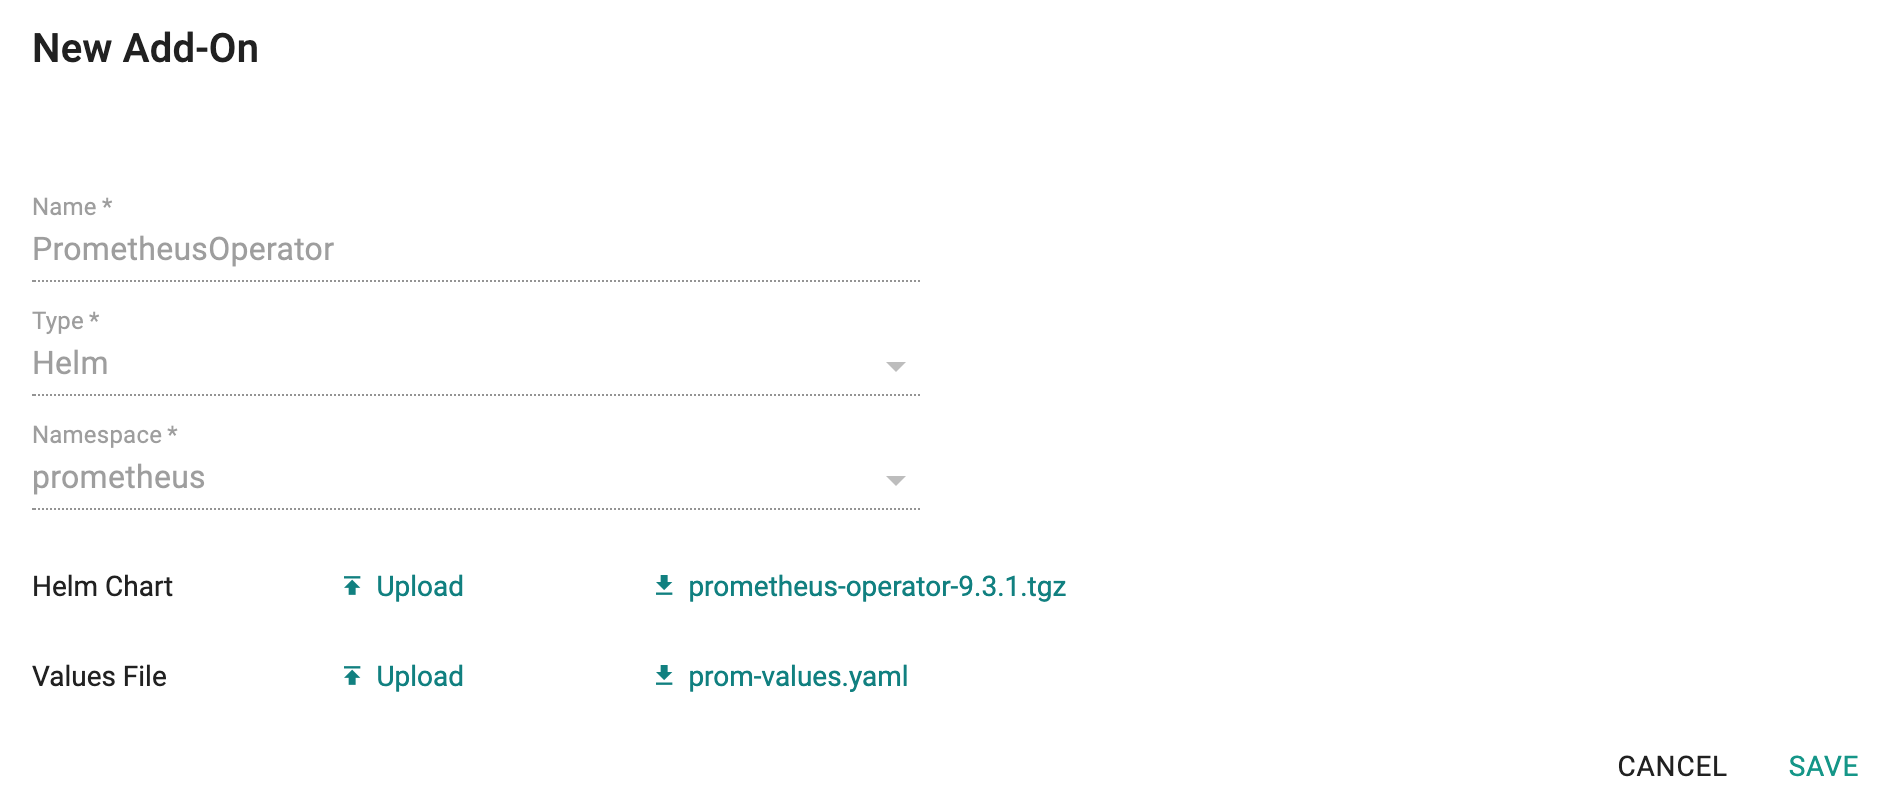
- Select "Addons" and "Create" a new Addon called "prometheus"
- Ensure that you select "Helm" for type and select the namespace as "prometheus"
- Upload the Helm chart "prometheus-operator-9.3.1.tgz" from the previous step, the "prom-values.yaml" file and Save
Once the addon is created, ensure you publish it and optionally provide a version so that it can be tracked.
Step 3: Create Blueprint
Now, we are ready to assemble a custom cluster blueprint using the newly created Prometheus Operator addon and the cert-manager addon.
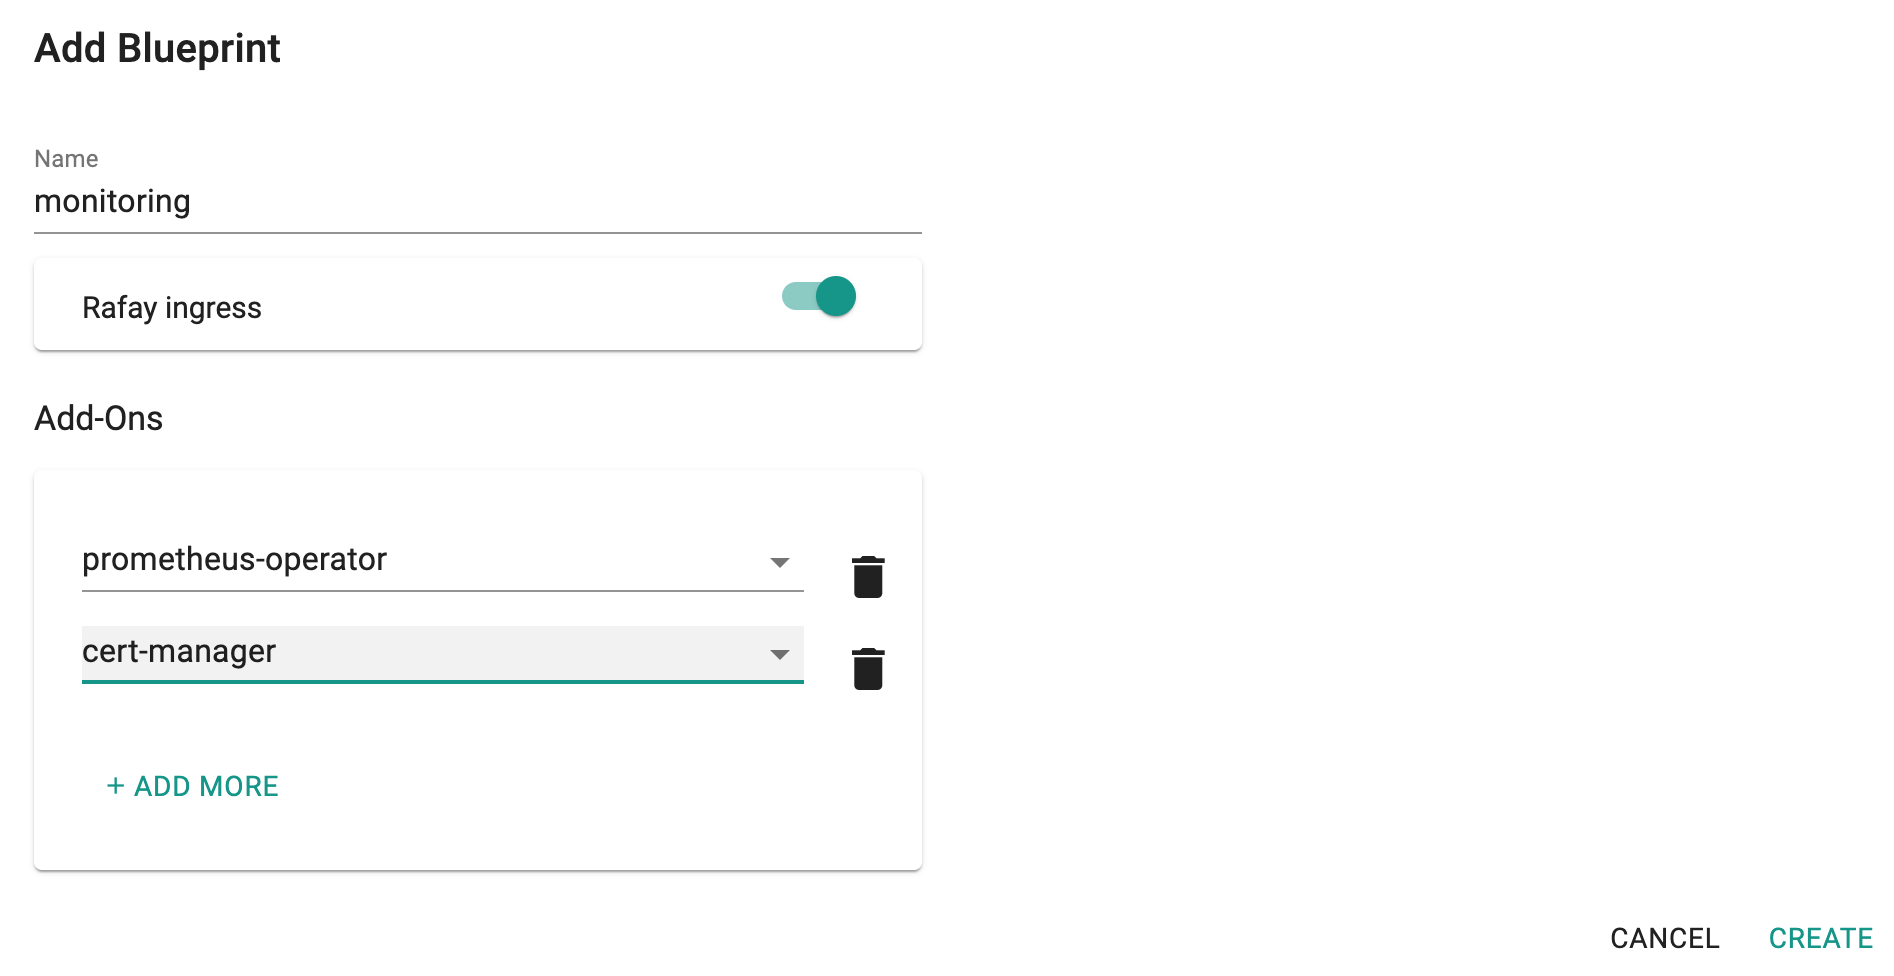
- Under Infrastructure, select "Blueprints"
- Create a new blueprint and give it a name such as "monitoring"
- Ensure that you have the managed Ingress enabled
- Select the prometheus and the cert-manager addons
Once the blueprint is created, ensure you publish it and optionally provide a version so that it can be tracked.
Step 4: Apply Blueprint
Now, we are ready to apply this custom blueprint to a cluster.
- Click on Options for the target Cluster in the Web Console
- Select "Update Blueprint" and select the "monitoring" blueprint we created from the list
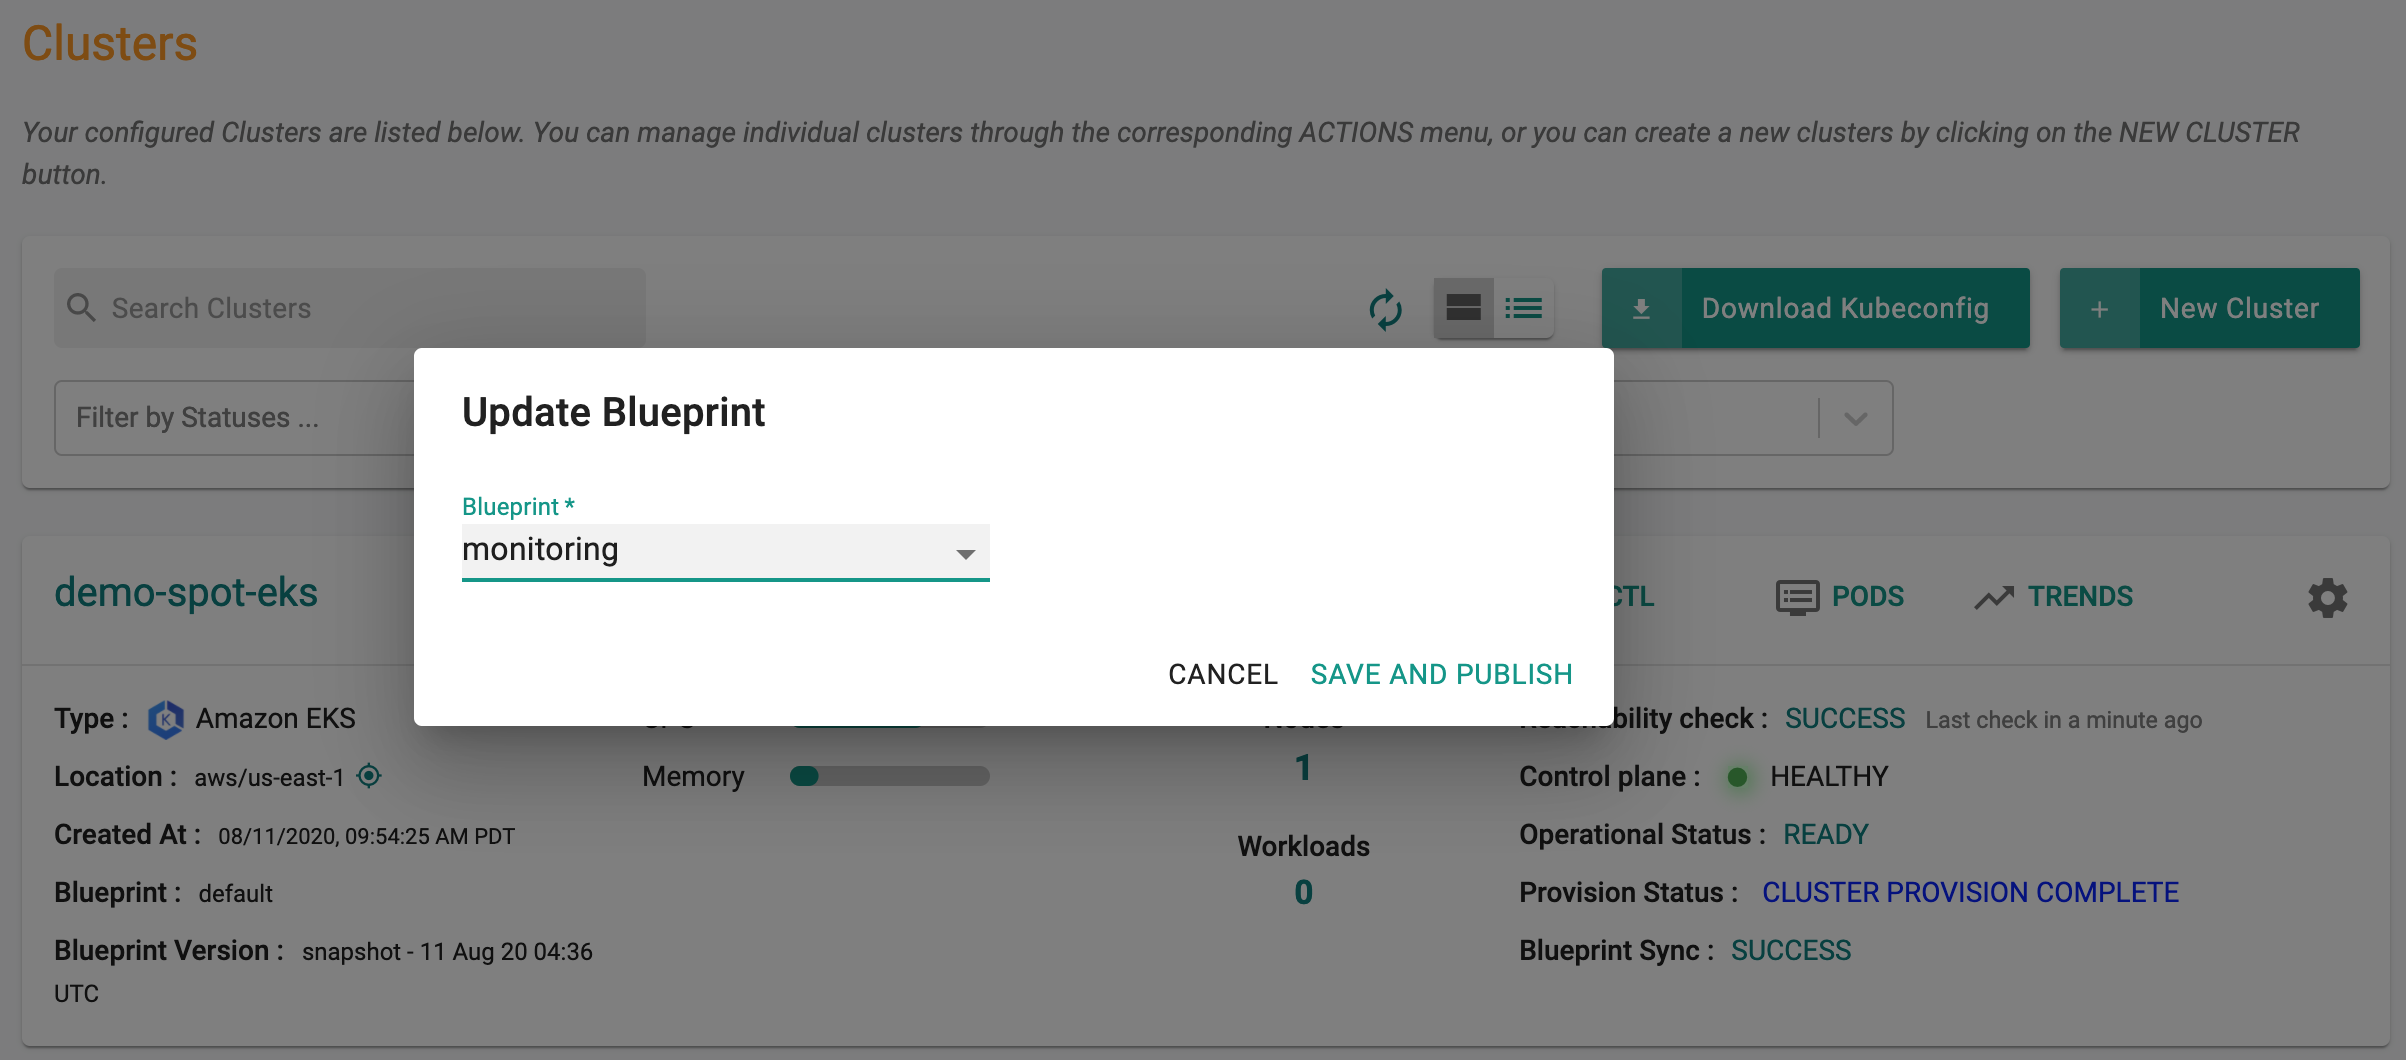
Click on "Save and Publish".
This will start the deployment of the addons configured in the "monitoring" blueprint to the targeted cluster. The blueprint sync process can take a few minutes. Once complete, the cluster will display the current cluster blueprint details and whether the sync was successful or not.
Step 6: Verify Deployment
Users can optionally verify whether the correct resources have been created on the cluster.
- Click on the Kubectl button on the cluster to open a virtual terminal
- First, we will verify if the "prometheus" namespace has been created
kubectl get ns prometheus

NAME         STATUS   AGE
prometheus   Active   20s
- Next, we will verify the pods in the "prometheus" namespace. You should see something like the example below.
kubectl get po -n prometheus

NAME                                                         READY   STATUS      RESTARTS   AGE
prometheus-operator-v1-admission-create-n4dz6                0/1     Completed   0          27s
prometheus-operator-v1-admission-patch-2q4zt                 0/1     Completed   1          27s
prometheus-operator-v1-grafana-54c57b8895-zdwrb              2/2     Running     0          27s
prometheus-operator-v1-grafana-test                          0/1     Error       0          27s
prometheus-operator-v1-kube-state-metrics-8656f4d54f-ttmwr   1/1     Running     0          27s
prometheus-operator-v1-operator-7b4b9fc67d-ss8dz             2/2     Running     0          27s
prometheus-operator-v1-prometheus-node-exporter-7fkzf        1/1     Running     0          27s
Next, we will verify if the Prometheus Rules have been created.
get prometheusrules -n prometheus

NAME                                                          AGE
prometheus-operator-v1-alertmanager.rules                     112s
prometheus-operator-v1-etcd                                   103s
prometheus-operator-v1-general.rules                          119s
prometheus-operator-v1-k8s.rules                              2m2s
prometheus-operator-v1-kube-apiserver-availability.rules      2m5s
prometheus-operator-v1-kube-apiserver-slos                    2m9s
prometheus-operator-v1-kube-apiserver.rules                   108s
prometheus-operator-v1-kube-prometheus-general.rules          105s
prometheus-operator-v1-kube-prometheus-node-recording.rules   109s
prometheus-operator-v1-kube-scheduler.rules                   2m1s
prometheus-operator-v1-kube-state-metrics                     2m6s
prometheus-operator-v1-kubelet.rules                          113s
prometheus-operator-v1-kubernetes-apps                        103s
prometheus-operator-v1-kubernetes-resources                   118s
prometheus-operator-v1-kubernetes-storage                     2m
prometheus-operator-v1-kubernetes-system                      110s
prometheus-operator-v1-kubernetes-system-apiserver            2m10s
prometheus-operator-v1-kubernetes-system-controller-manager   115s
prometheus-operator-v1-kubernetes-system-kubelet              113s
prometheus-operator-v1-kubernetes-system-scheduler            106s
prometheus-operator-v1-node-exporter                          111s
prometheus-operator-v1-node-exporter.rules                    2m7s
prometheus-operator-v1-node-network                           2m7s
prometheus-operator-v1-node.rules                             101s
prometheus-operator-v1-prometheus                             116s
prometheus-operator-v1-prometheus-operator                    2m10s
Finally, we will verify whether the required Service Monitors have been created
kubectl get servicemonitors -n prometheus

NAME                                             AGE
prometheus-operator-v1-alertmanager              3m20s
prometheus-operator-v1-apiserver                 3m18s
prometheus-operator-v1-coredns                   3m24s
prometheus-operator-v1-grafana                   3m41s
prometheus-operator-v1-kube-controller-manager   3m25s
prometheus-operator-v1-kube-etcd                 3m38s
prometheus-operator-v1-kube-proxy                3m46s
prometheus-operator-v1-kube-scheduler            3m22s
prometheus-operator-v1-kube-state-metrics        3m35s
prometheus-operator-v1-kubelet                   3m28s
prometheus-operator-v1-node-exporter             3m42s
prometheus-operator-v1-operator                  3m35s
prometheus-operator-v1-prometheus                3m41s
Step 7: Access Grafana
Now we will access the Grafana Dashboard. In our example, the dashboard is accessible at "https://grafana.infra.gorafay.net". You can verify this by using the following command.
kubectl get ing -n prometheus
NAME                             HOSTS                       ADDRESS        PORTS     AGE
cm-acme-http-solver-lmtf5        grafana.infra.gorafay.net   10.100.61.68   80        3m46s
prometheus-operator-v1-grafana   grafana.infra.gorafay.net   10.100.61.68   80, 443   6m34s
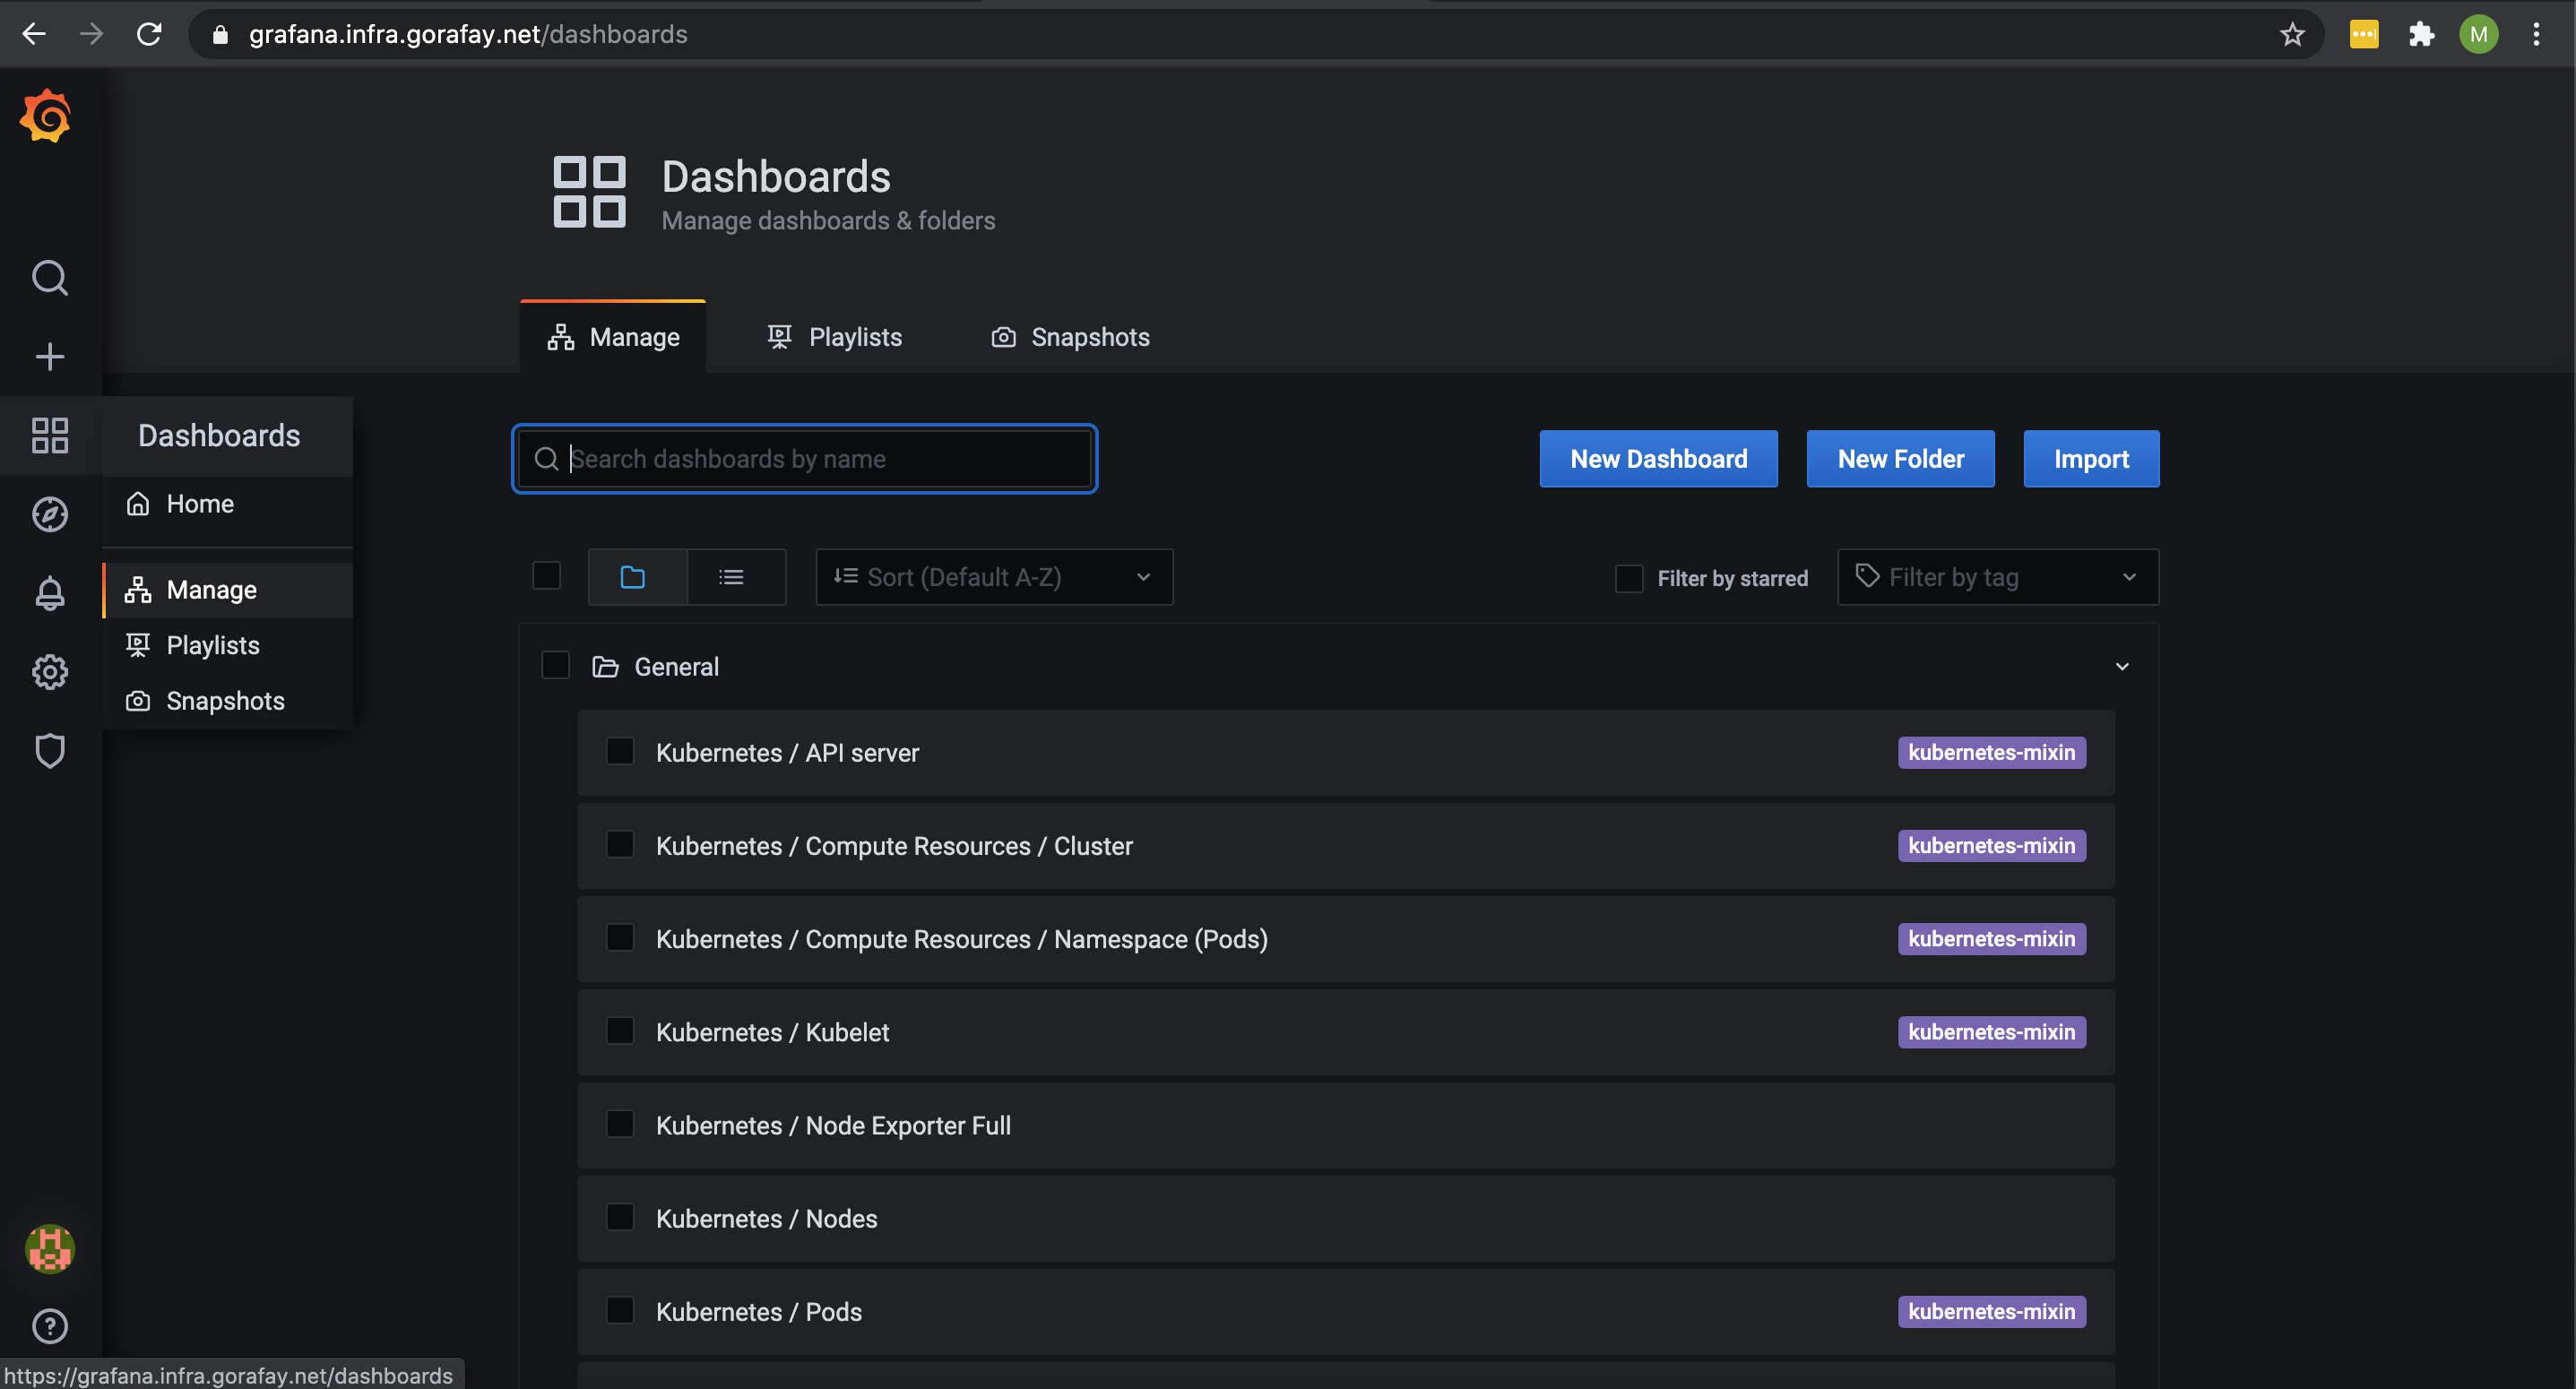
- Open a web browser and navigate to the URL where your Grafana is accessible.
- Login into Grafana using the credentials you provided and you should see the dashboards you configured.
Shown below is an illustrative example of what you should see when you access Grafana.
Recap
Congratulations! You have successfully created a custom cluster blueprint with the "Prometheus Operator" and "Cert-Manager" addons and applied to a cluster. You can now use this blueprint on as many clusters as you require.