Get Started with the Rafay MCP Server
Overview
This guide walks you through using the Rafay MCP server in Claude to perform two key workflows:
- Fleet Reporting — Generate executive-level reports covering cluster health, utilization, and cost consolidation across your entire fleet without opening the Rafay console
- Cluster Troubleshooting — Identify, diagnose, and remediate Kubernetes issues using natural language powered by Rafay platform visibility
Assumptions
This guide assumes the following are already in place:
- You have an active Rafay Platform account with operator-level access
- The Rafay MCP server is installed and configured in Claude Desktop
- An active managed Kubernetes cluster
If you have not yet installed and configured the Rafay MCP server, refer to the Rafay MCP Server Setup Guide before proceeding.
What You Will Do
| Step | Action |
|---|---|
| 1 | Run fleet inventory and health reporting |
| 2 | Analyze cluster utilization and consolidation opportunities |
| 3 | Calculate cost based on actual cluster resource specs |
| 4 | Create demo issues on a cluster for troubleshooting |
| 5 | Diagnose and remediate issues using the MCP server |
Part 1 — Fleet Reporting
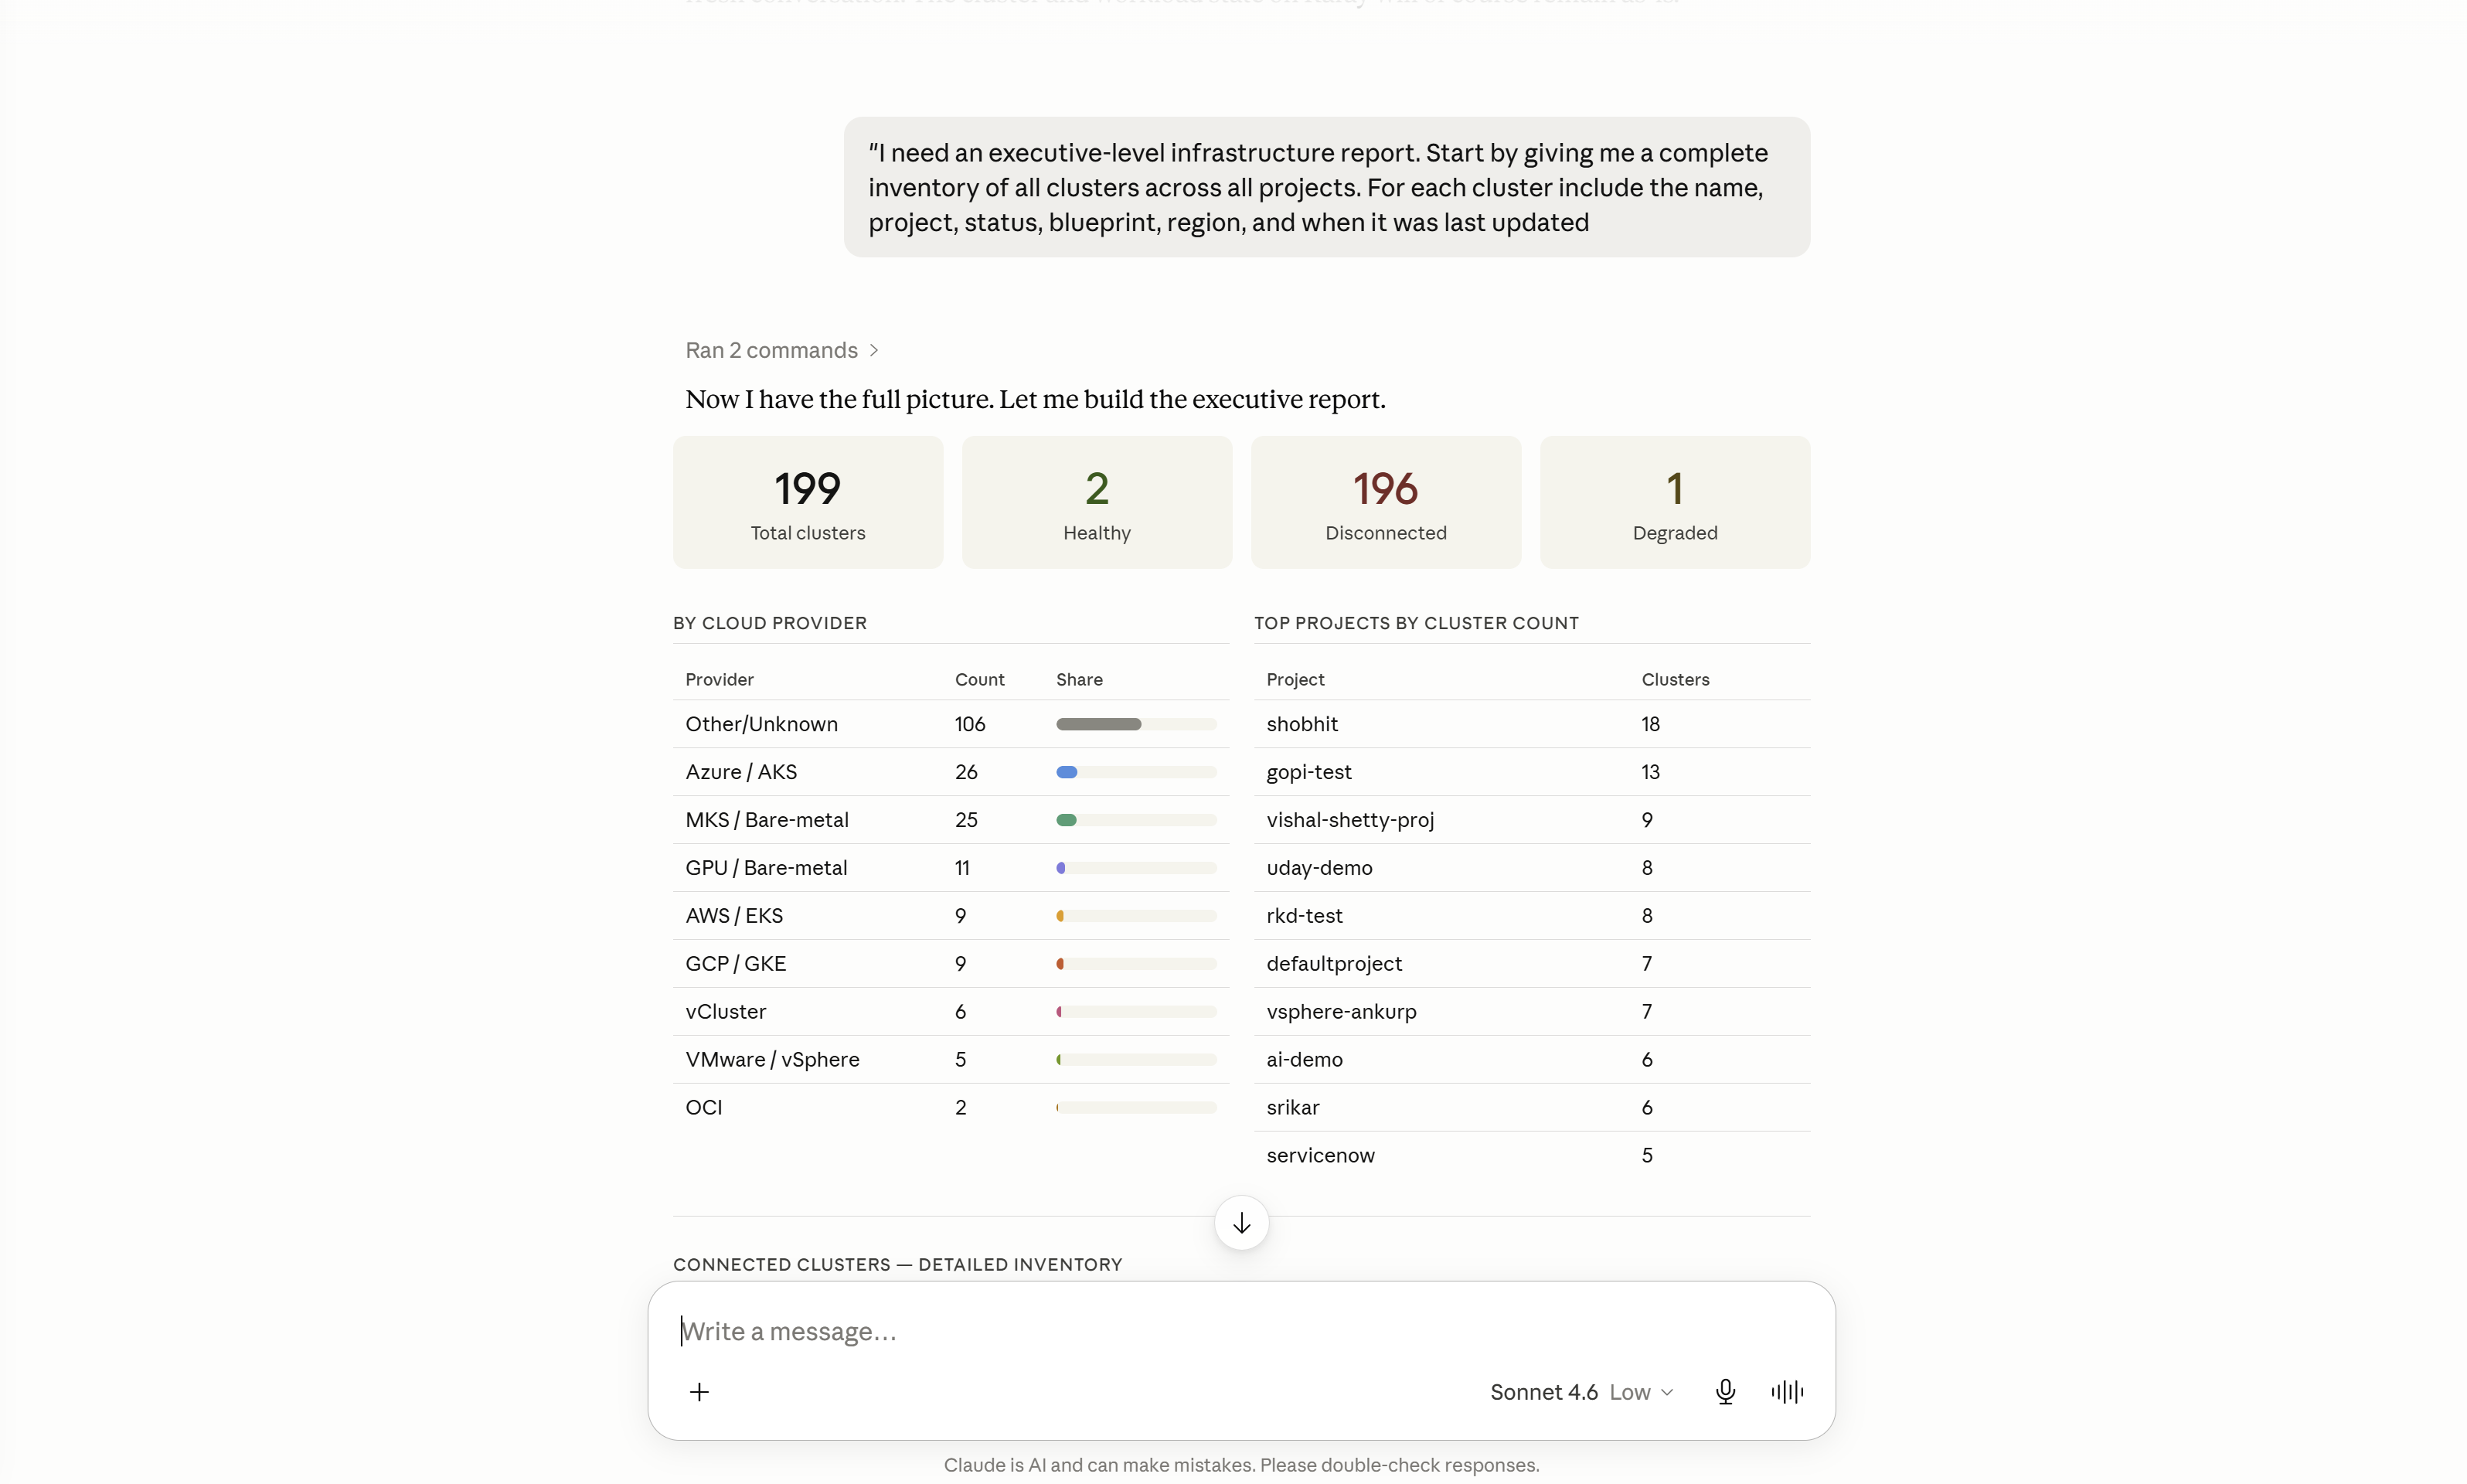
Step 1 — Fleet Inventory
Start a new Claude conversation. Use the Rafay MCP server to pull a complete inventory of your fleet:
"I need an executive-level infrastructure report. Start by giving me a complete inventory of all clusters across all projects. For each cluster include the name, project, status, blueprint, region, and when it was last updated."
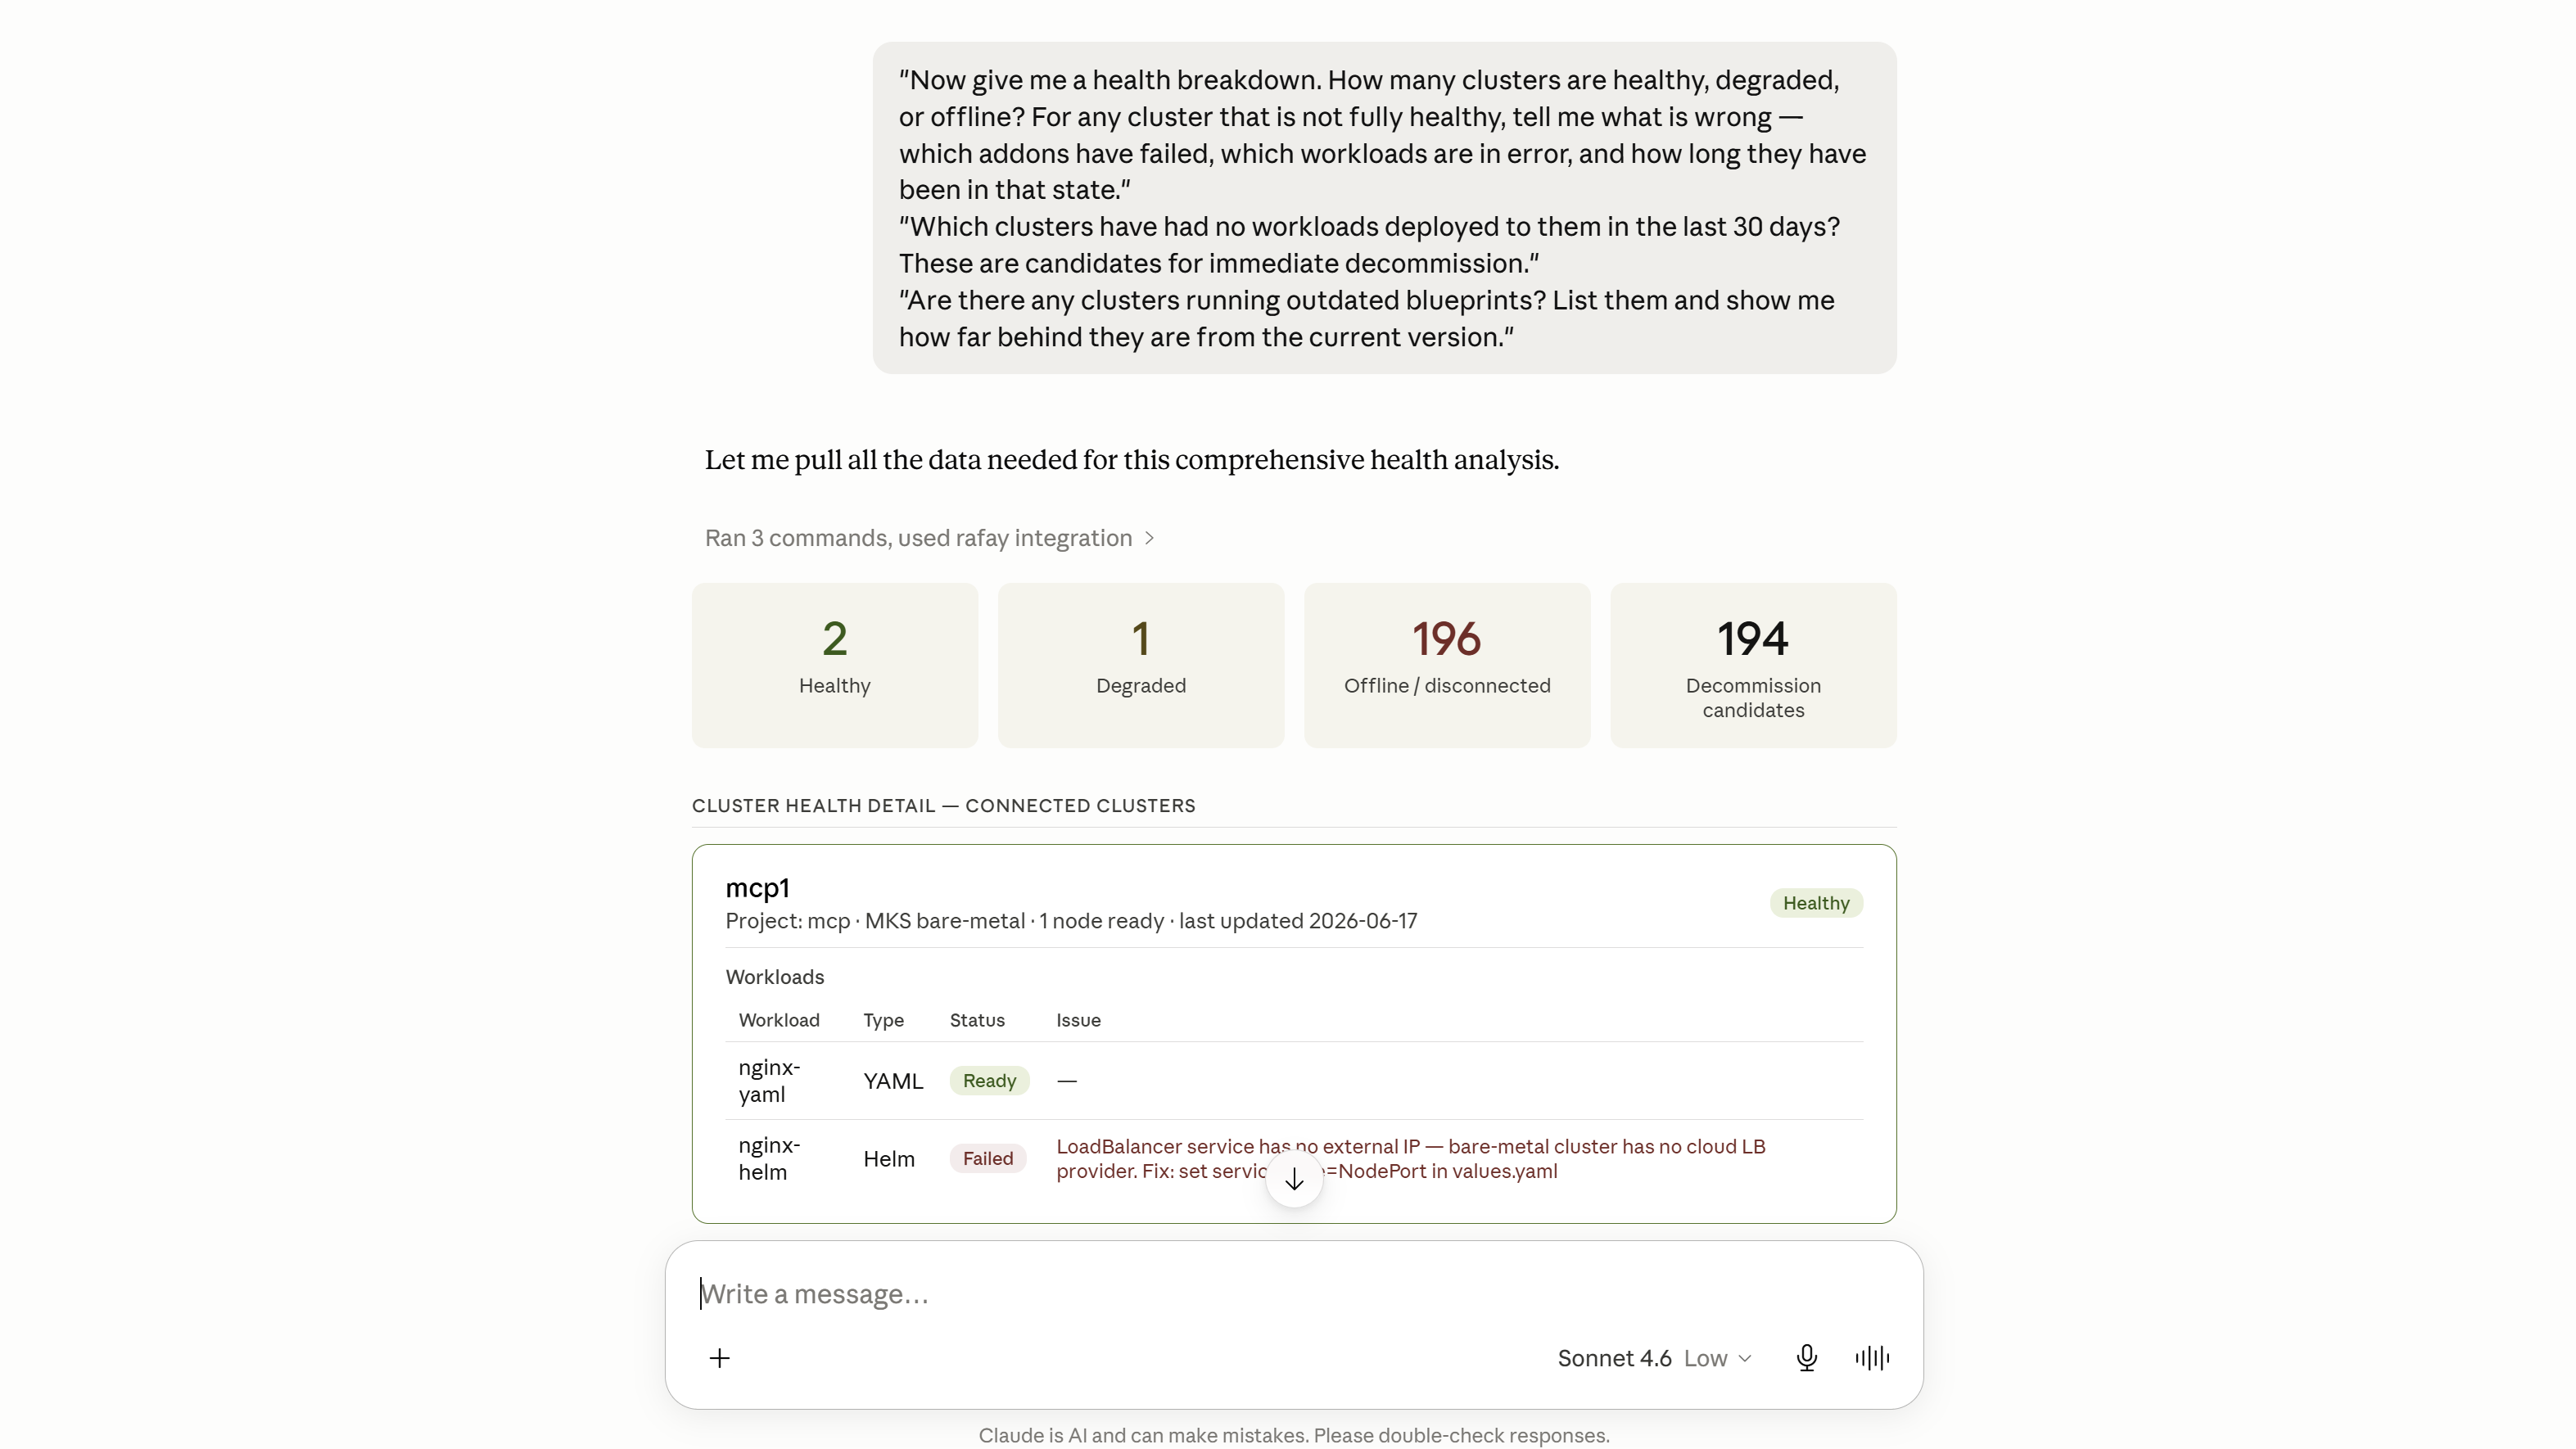
Step 2 — Health & Status Analysis
"Now give me a health breakdown. How many clusters are healthy, degraded, or offline? For any cluster that is not fully healthy, tell me what is wrong — which addons have failed, which workloads are in error, and how long they have been in that state."
"Which clusters have had no workloads deployed to them in the last 30 days? These are candidates for immediate decommission."
"Are there any clusters running outdated blueprints? List them and show me how far behind they are from the current version."
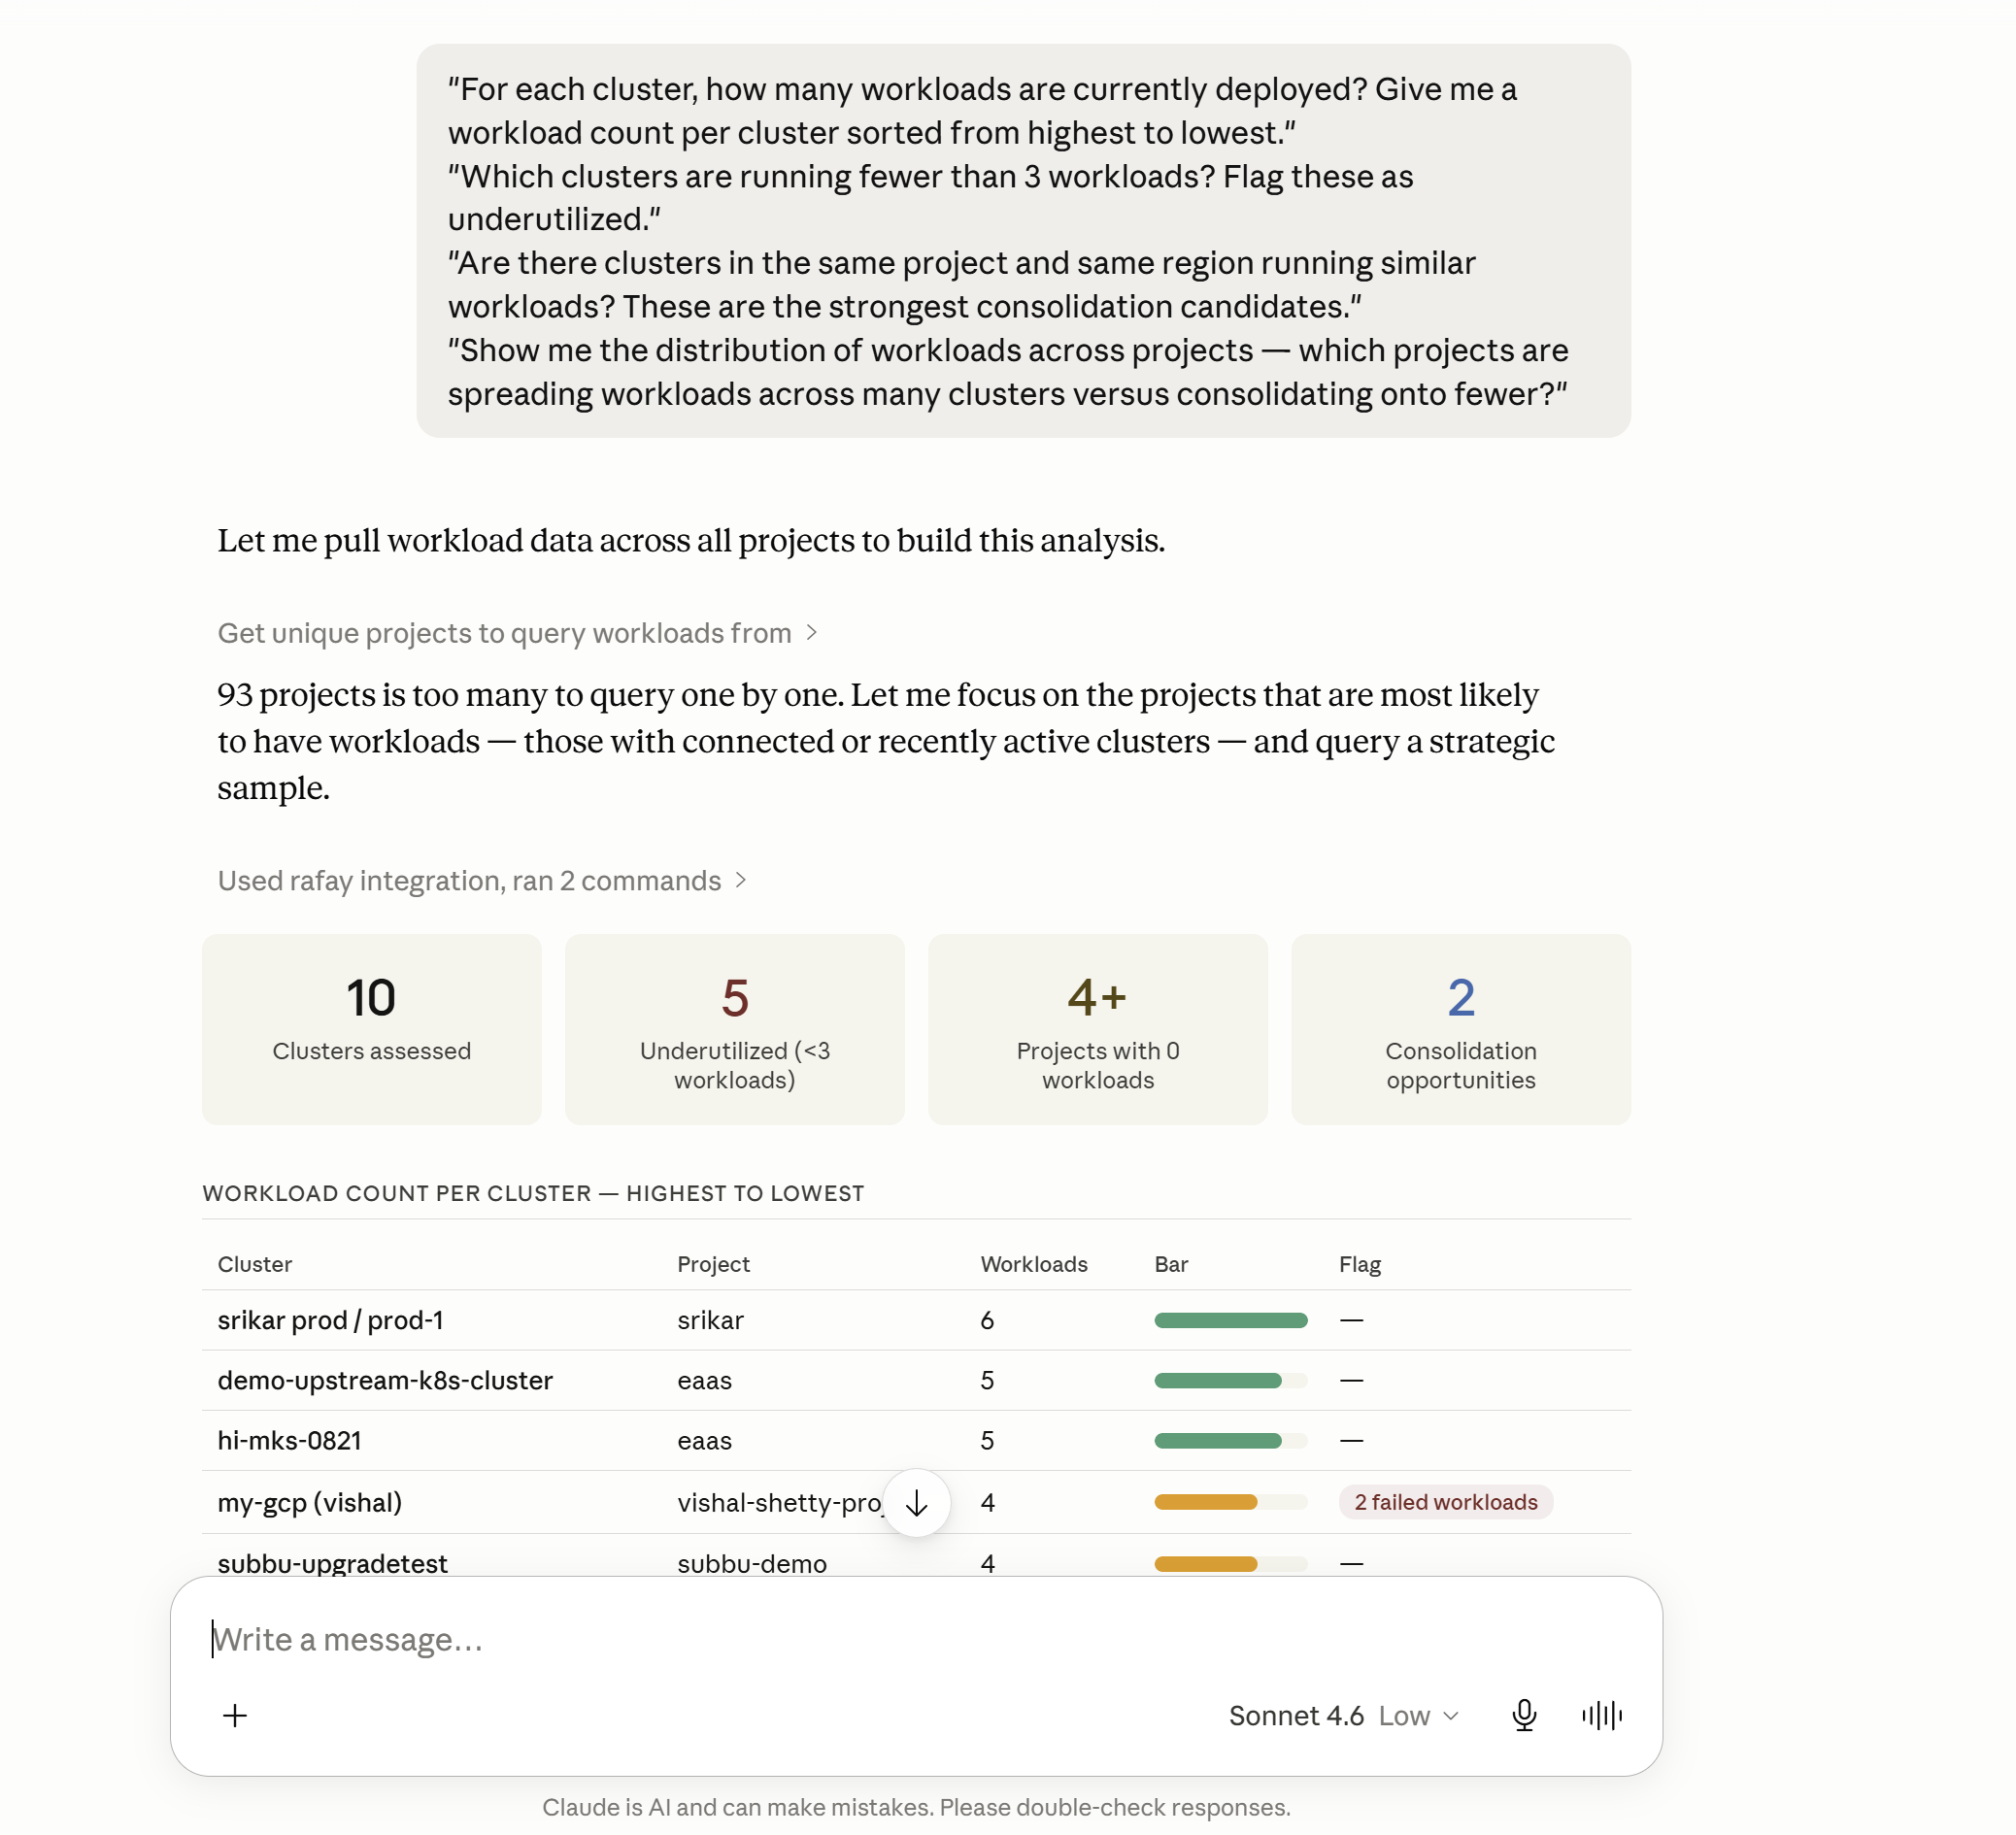
Step 3 — Utilization Analysis
"For each cluster, how many workloads are currently deployed? Give me a workload count per cluster sorted from highest to lowest."
"Which clusters are running fewer than 3 workloads? Flag these as underutilized."
"Are there clusters in the same project and same region running similar workloads? These are the strongest consolidation candidates."
"Show me the distribution of workloads across projects — which projects are spreading workloads across many clusters versus consolidating onto fewer?"
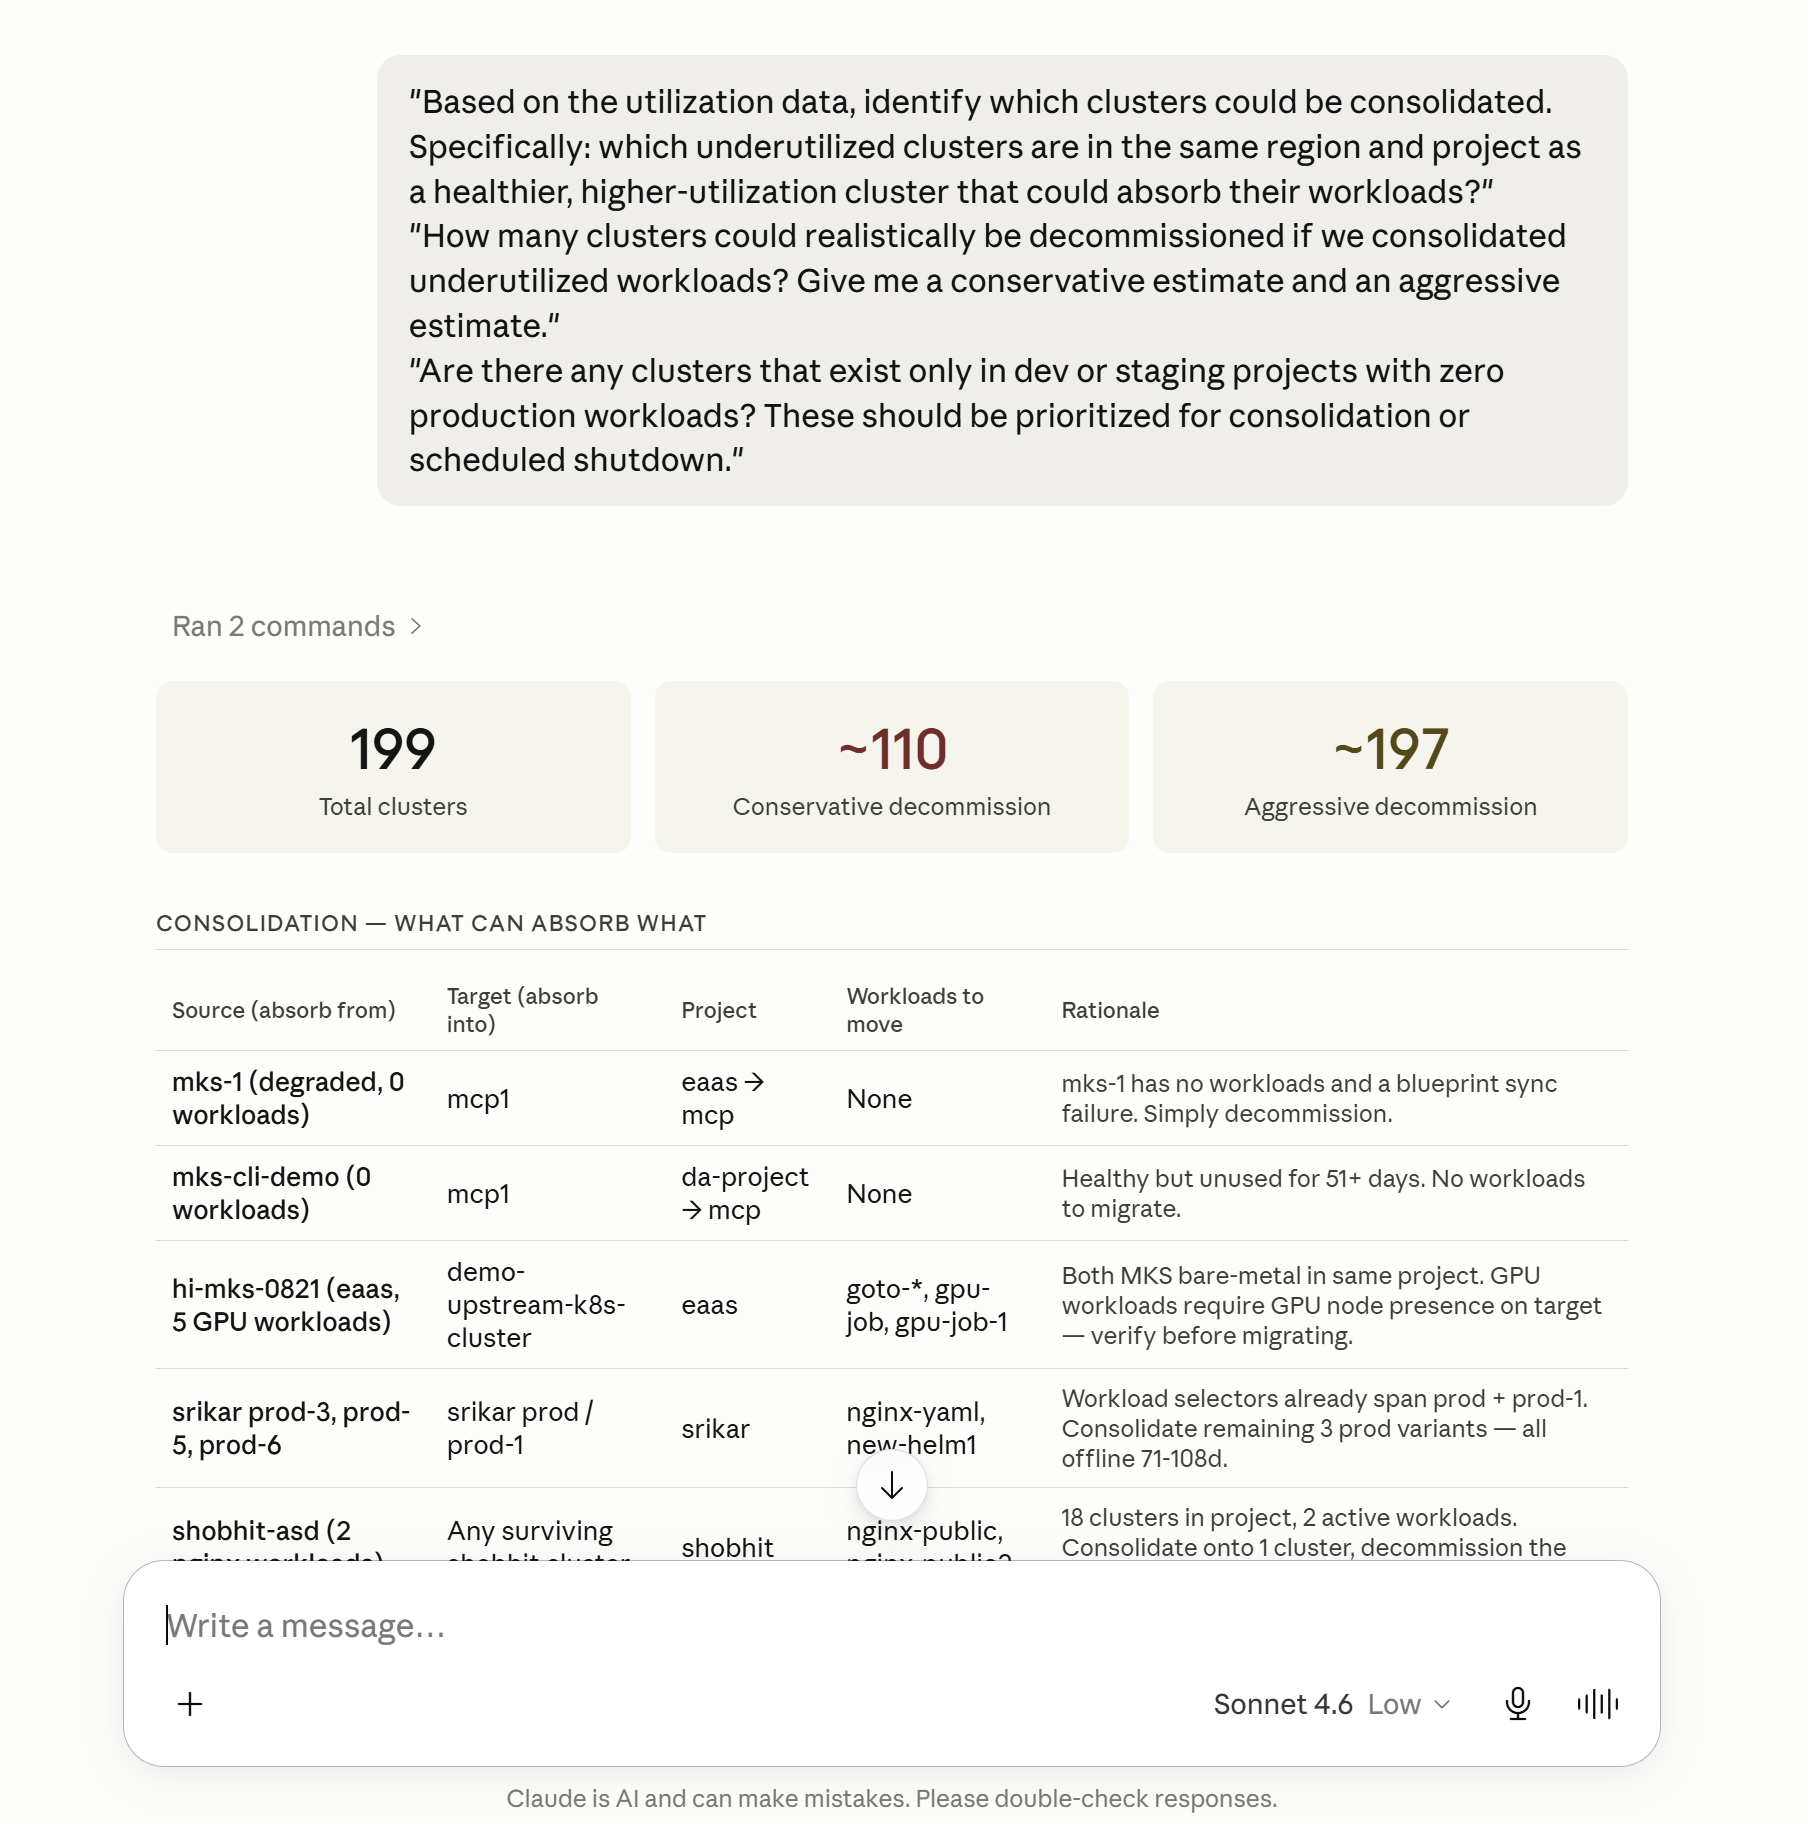
Step 4 — Consolidation Analysis
"Based on the utilization data, identify which clusters could be consolidated. Specifically: which underutilized clusters are in the same region and project as a healthier, higher-utilization cluster that could absorb their workloads?"
"How many clusters could realistically be decommissioned if we consolidated underutilized workloads? Give me a conservative estimate and an aggressive estimate."
"Are there any clusters that exist only in dev or staging projects with zero production workloads? These should be prioritized for consolidation or scheduled shutdown."
Step 5 — Cost Analysis
Pull actual resource specifications
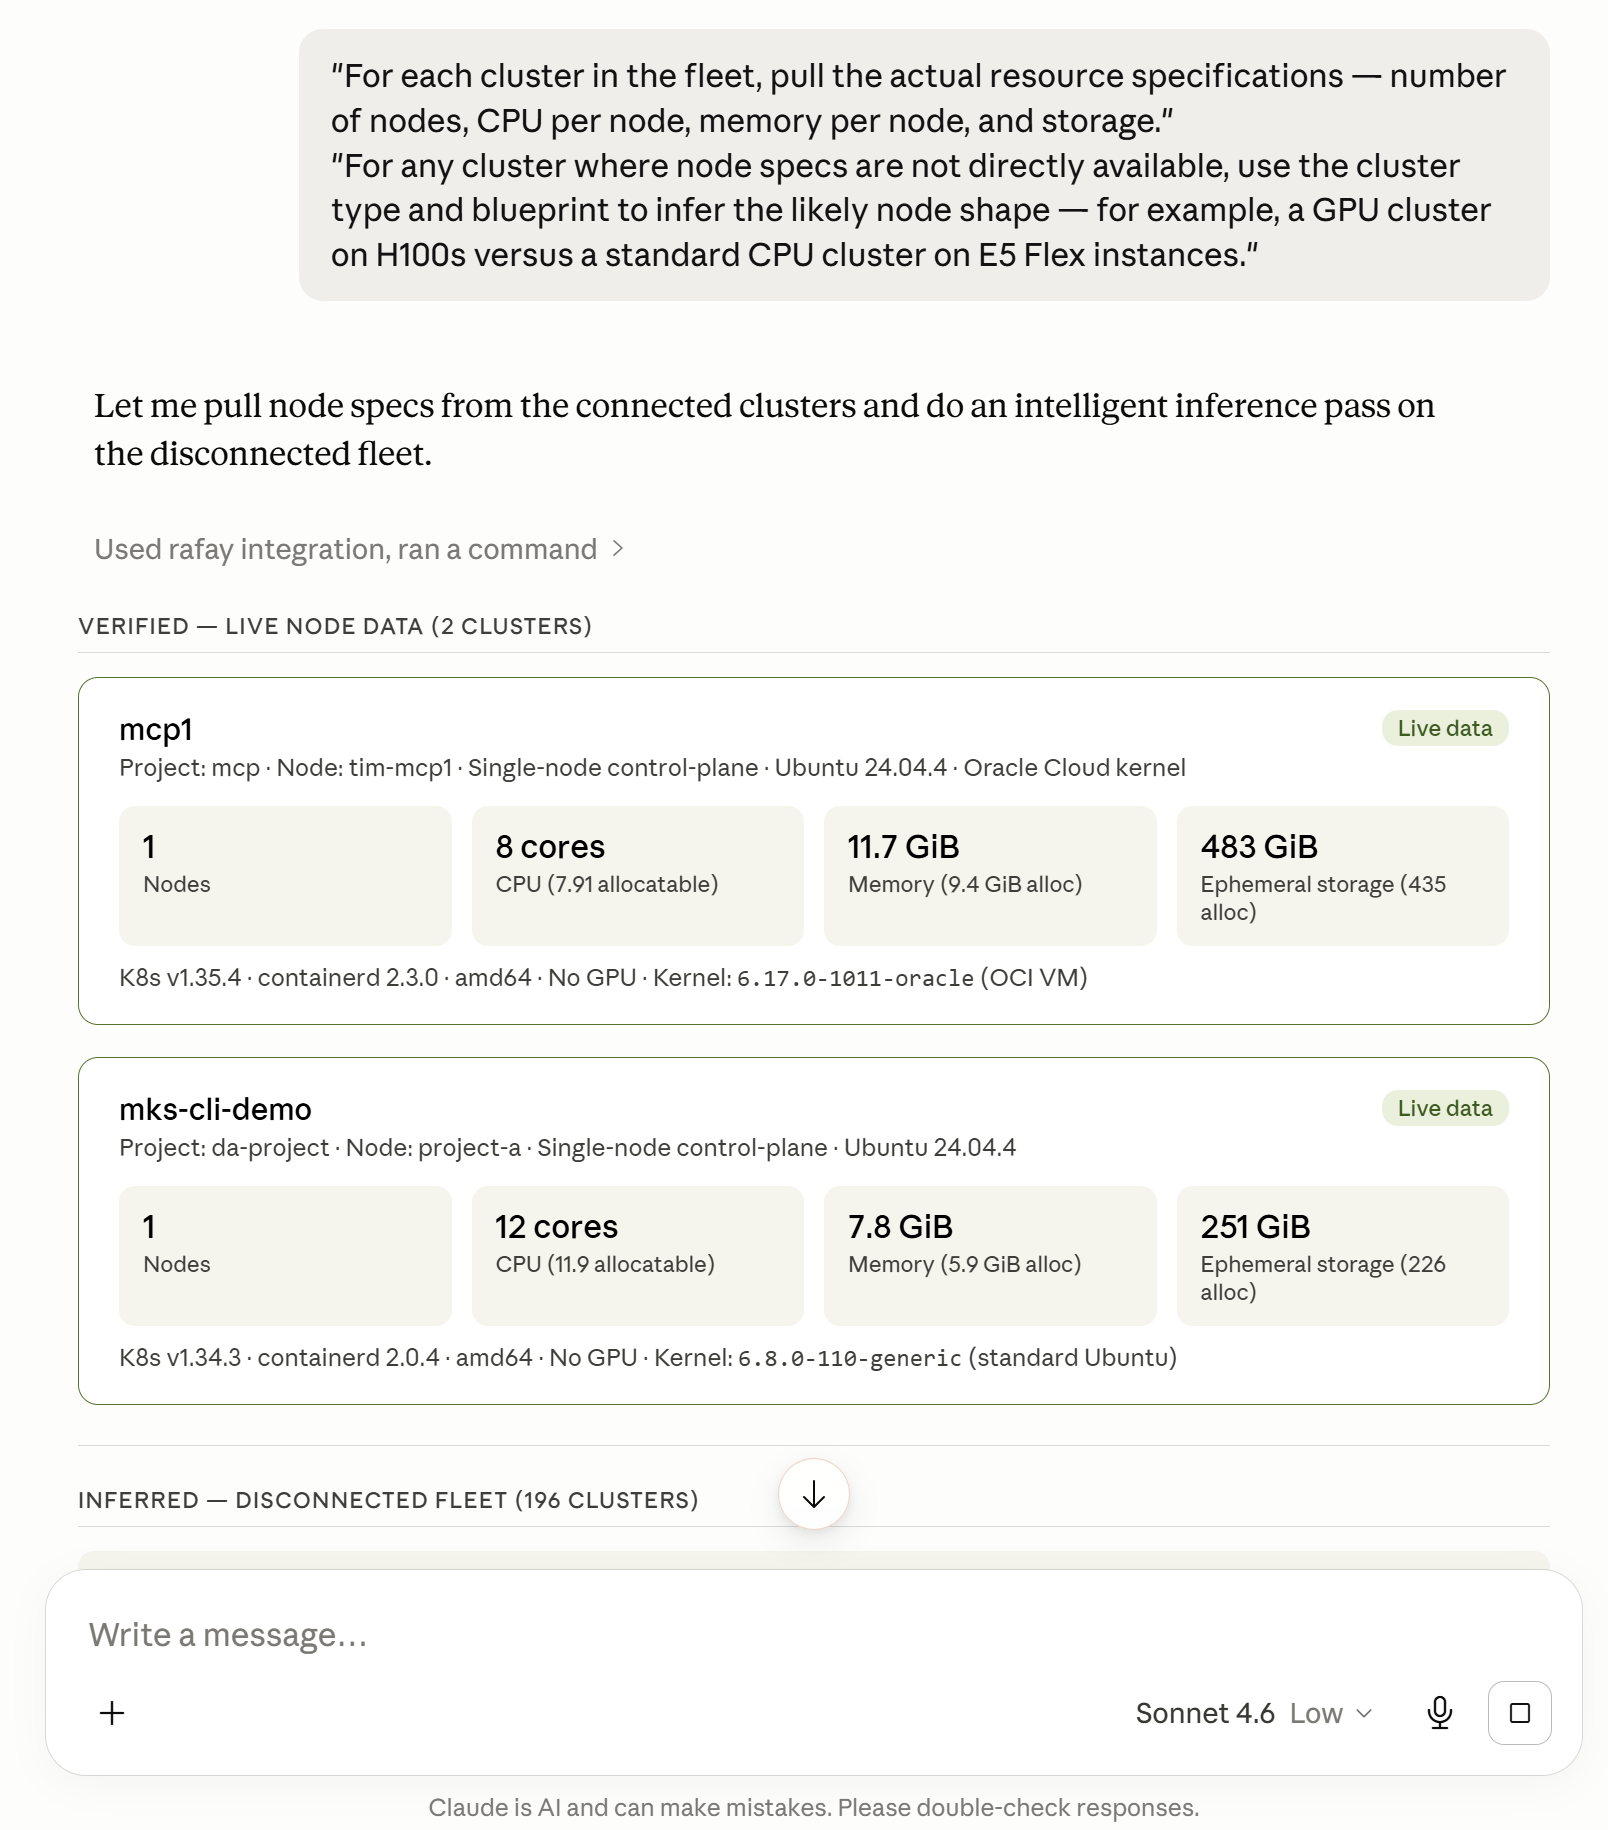
"For each cluster in the fleet, pull the actual resource specifications — number of nodes, CPU per node, memory per node, and storage."
"For any cluster where node specs are not directly available, use the cluster type and blueprint to infer the likely node shape — for example, a GPU cluster on H100s versus a standard CPU cluster on E5 Flex instances."
Apply cost rates
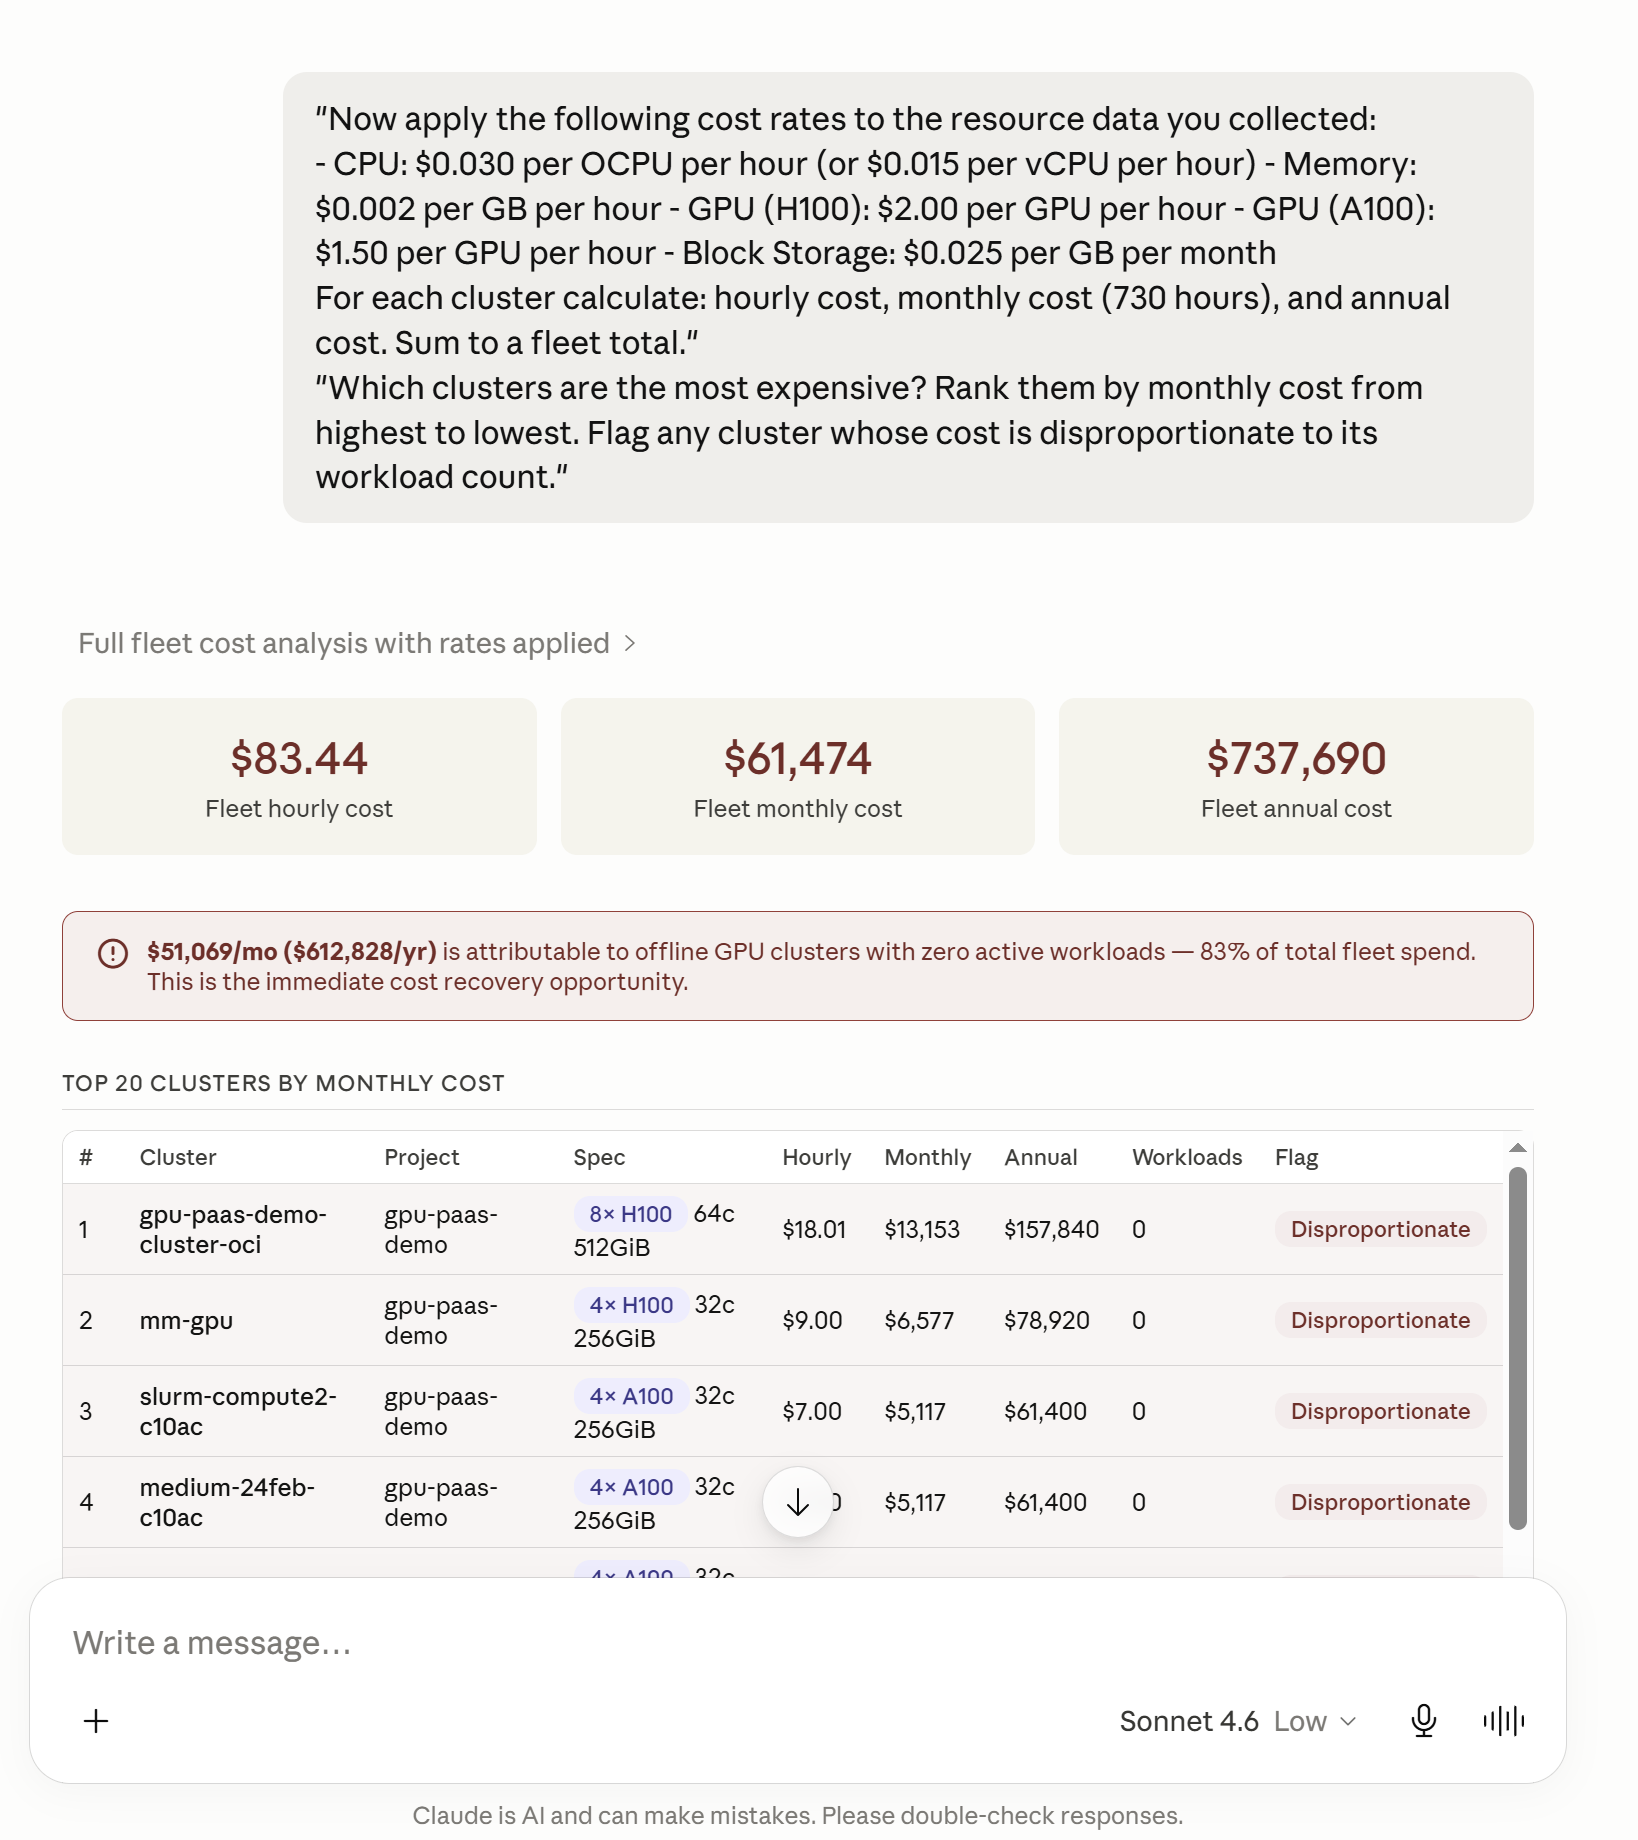
"Now apply the following cost rates to the resource data you collected:
- CPU: $0.030 per OCPU per hour (or $0.015 per vCPU per hour) - Memory: $0.002 per GB per hour - GPU (H100): $2.00 per GPU per hour - GPU (A100): $1.50 per GPU per hour - Block Storage: $0.025 per GB per month
For each cluster calculate: hourly cost, monthly cost (730 hours), and annual cost. Sum to a fleet total."
"Which clusters are the most expensive? Rank them by monthly cost from highest to lowest. Flag any cluster whose cost is disproportionate to its workload count."
Calculate consolidation savings
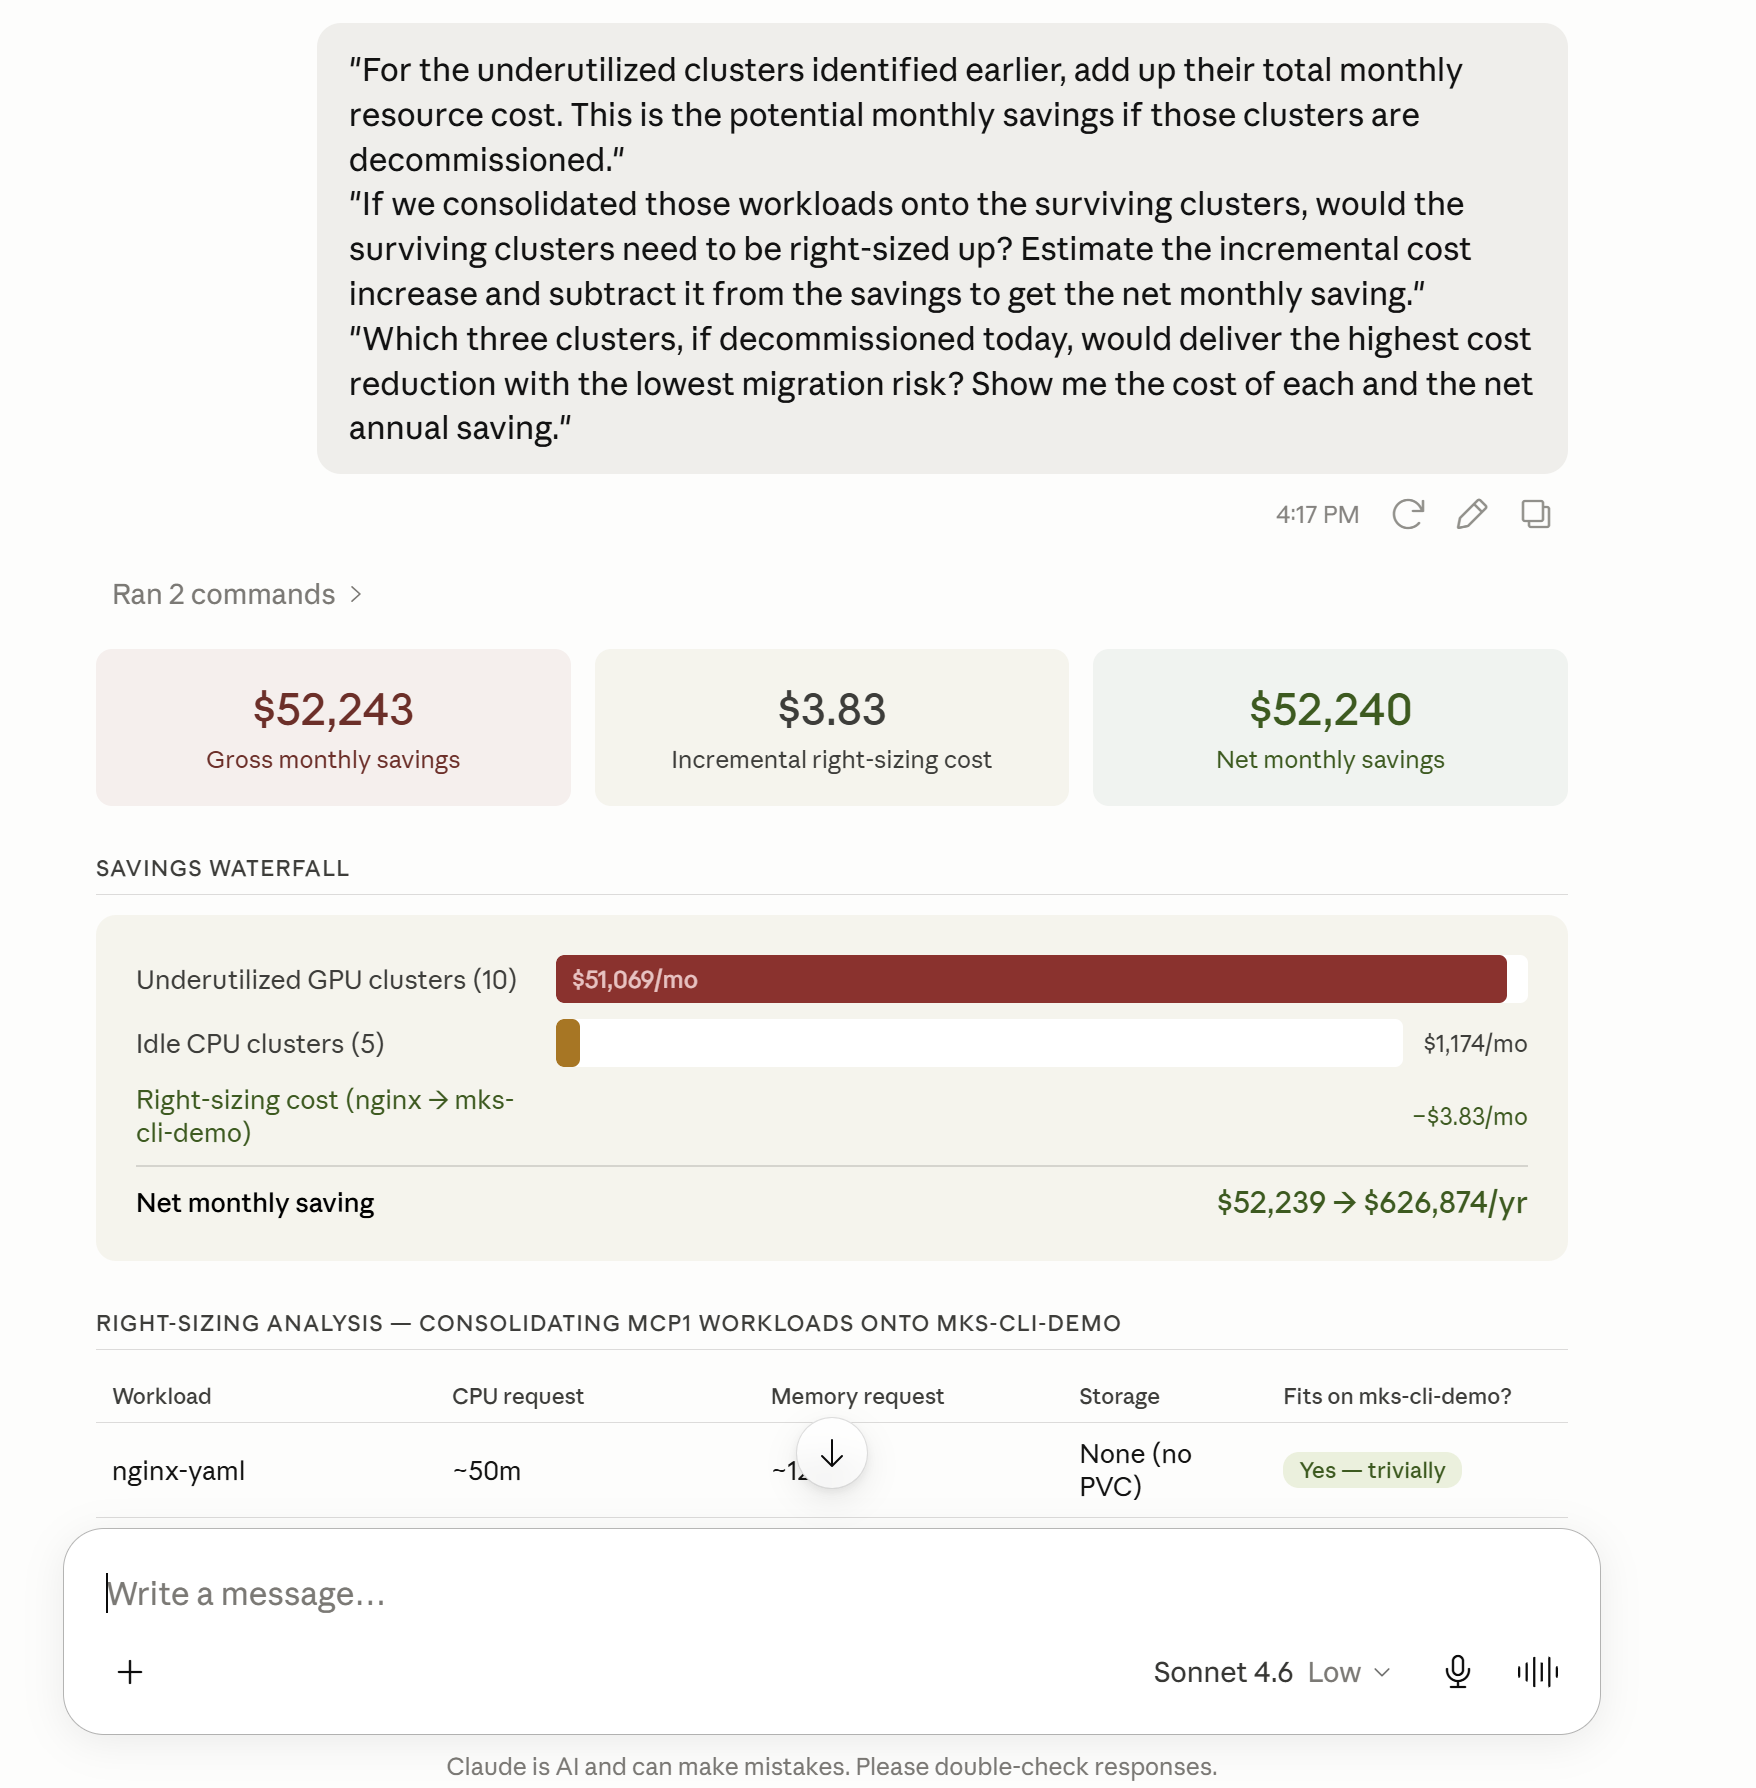
"For the underutilized clusters identified earlier, add up their total monthly resource cost. This is the potential monthly savings if those clusters are decommissioned."
"If we consolidated those workloads onto the surviving clusters, would the surviving clusters need to be right-sized up? Estimate the incremental cost increase and subtract it from the savings to get the net monthly saving."
"Which three clusters, if decommissioned today, would deliver the highest cost reduction with the lowest migration risk? Show me the cost of each and the net annual saving."
Build the cost summary table
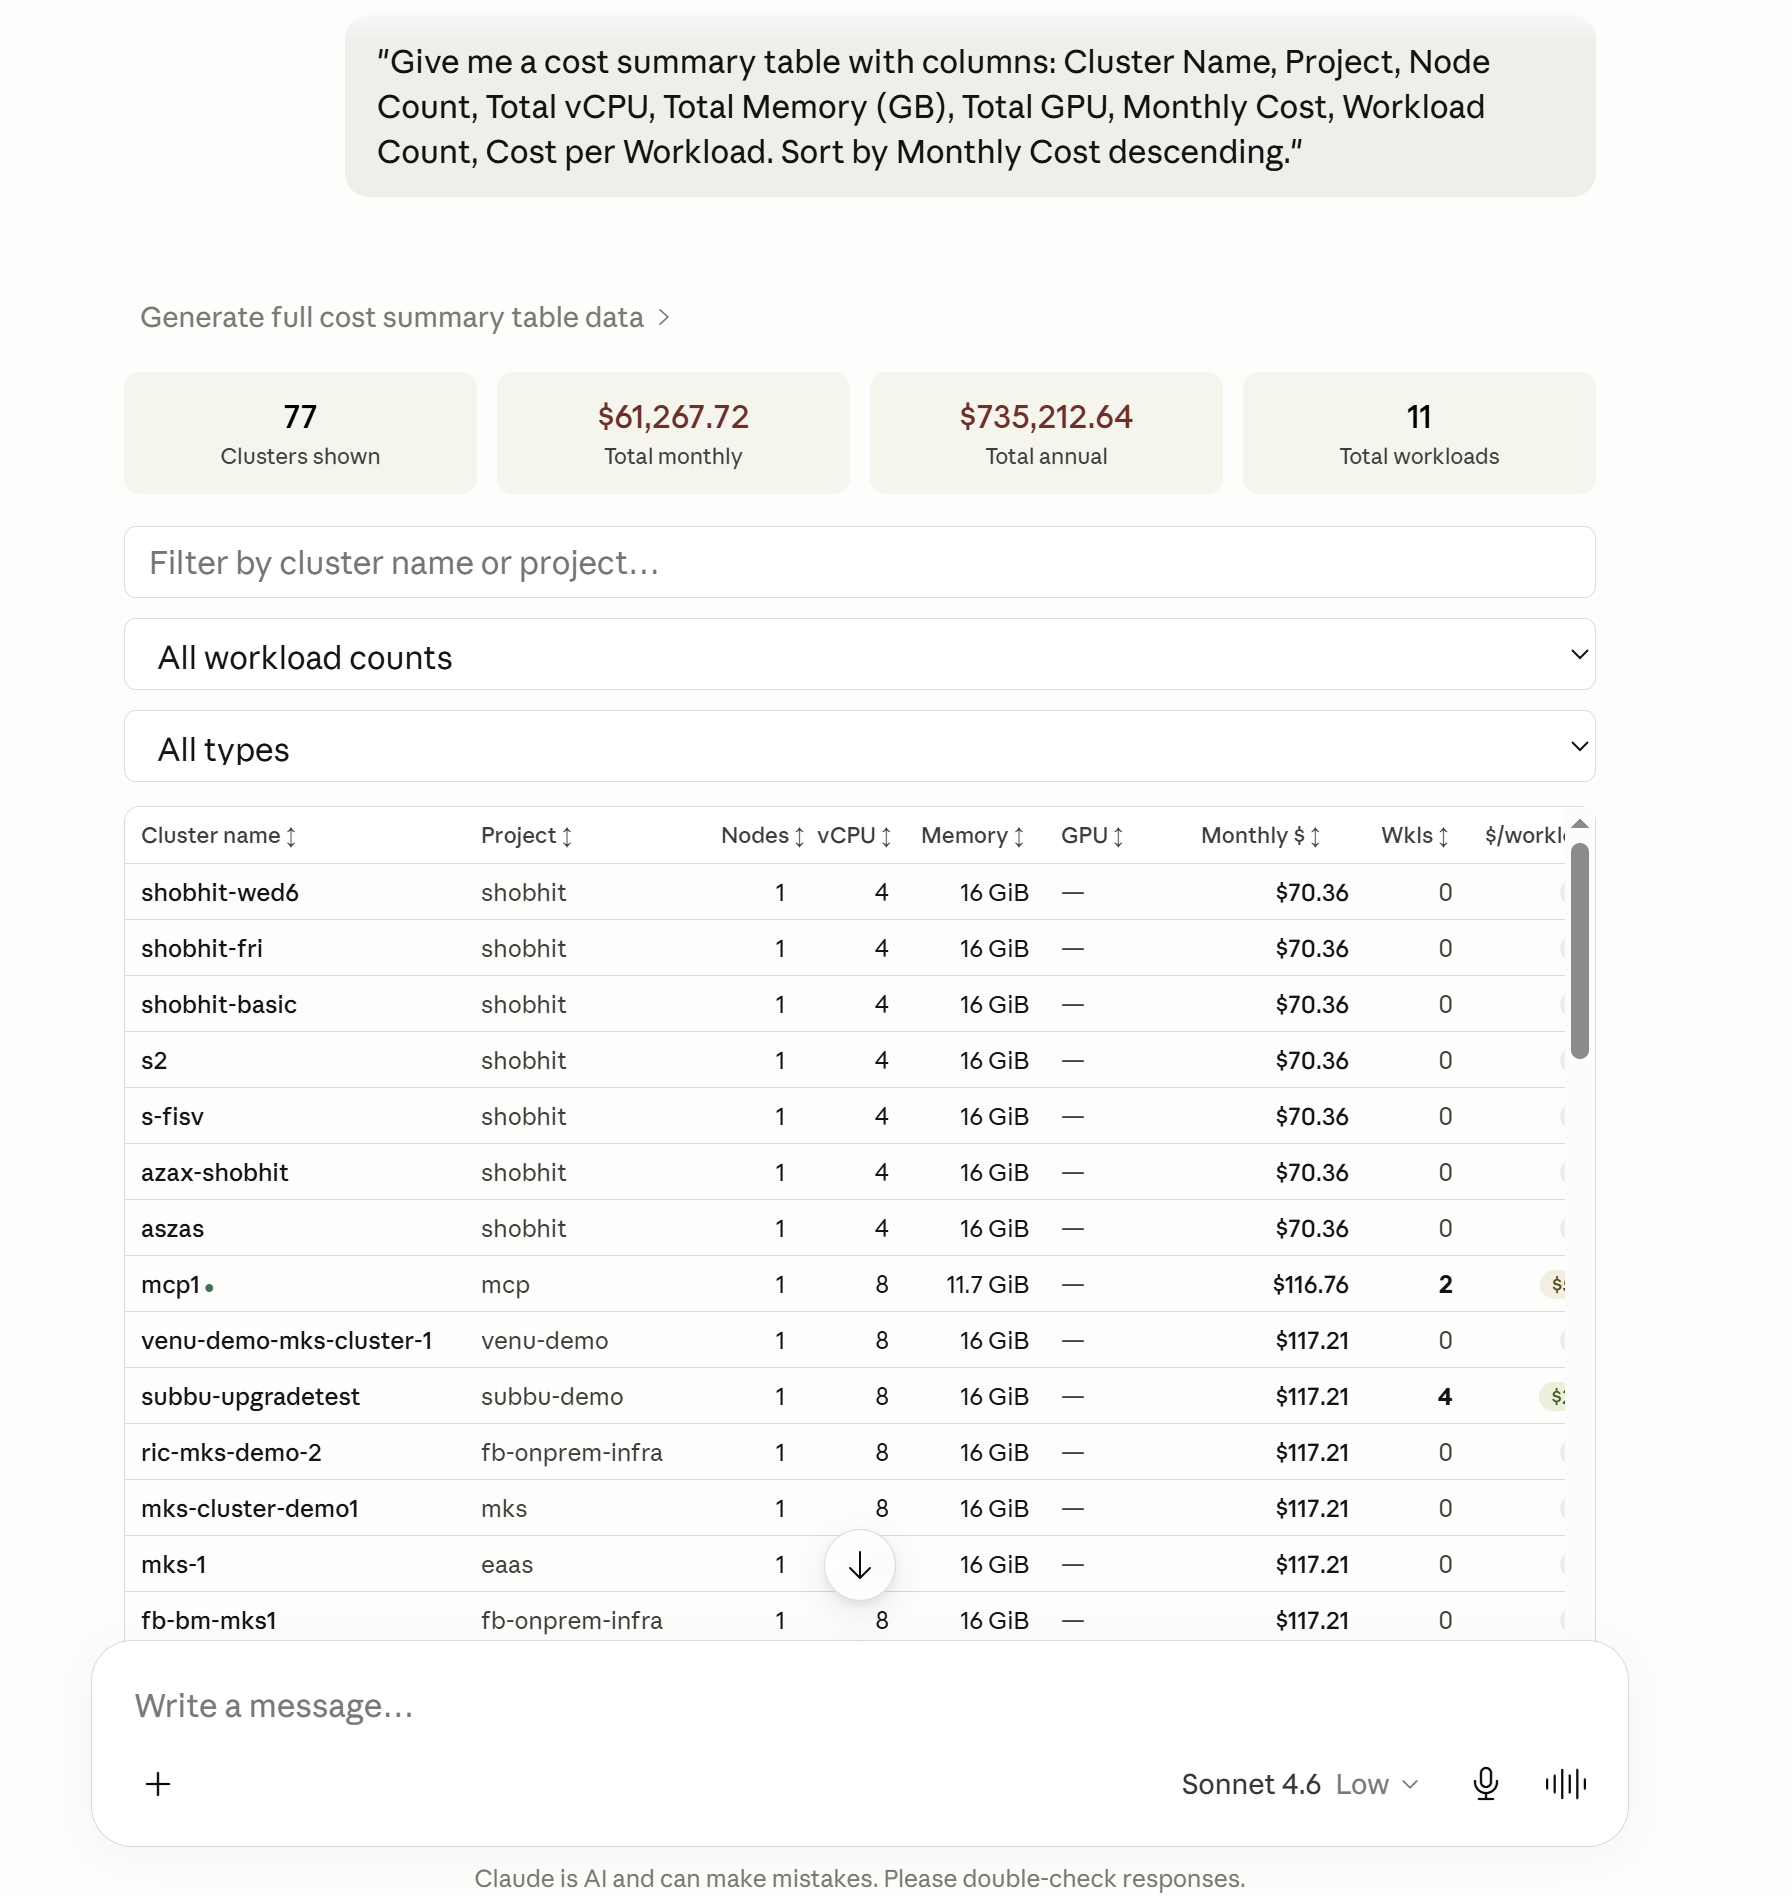
"Give me a cost summary table with columns: Cluster Name, Project, Node Count, Total vCPU, Total Memory (GB), Total GPU, Monthly Cost, Workload Count, Cost per Workload. Sort by Monthly Cost descending."
Part 2 — Cluster Troubleshooting
Step 1 — Create Demo Issues
Before running the troubleshooting prompts, deploy a set of broken resources onto a cluster to simulate a real-world incident.
Download the setup script and run it on the target cluster:
chmod +x create-cluster-issues.sh
./create-cluster-issues.sh
This creates the following broken resources in a demo-issues namespace:
| # | Resource | Issue |
|---|---|---|
| 1 | bad-image-pod |
ImagePullBackOff — invalid image tag |
| 2 | resource-hog-pod |
Pending — impossible resource requests |
| 3 | crashloop-pod |
CrashLoopBackOff — container exits with code 1 |
| 4 | broken-deployment |
0/3 replicas — bad image on all pods |
| 5 | no-endpoints-service |
No endpoints — selector matches no pods |
| 6 | missing-configmap-pod |
CreateContainerConfigError — ConfigMap not found |
| 7 | unbound-pvc |
Pending — storage class does not exist |
Step 2 — Fleet-Level Discovery
Use the Rafay MCP server to identify which cluster has problems:
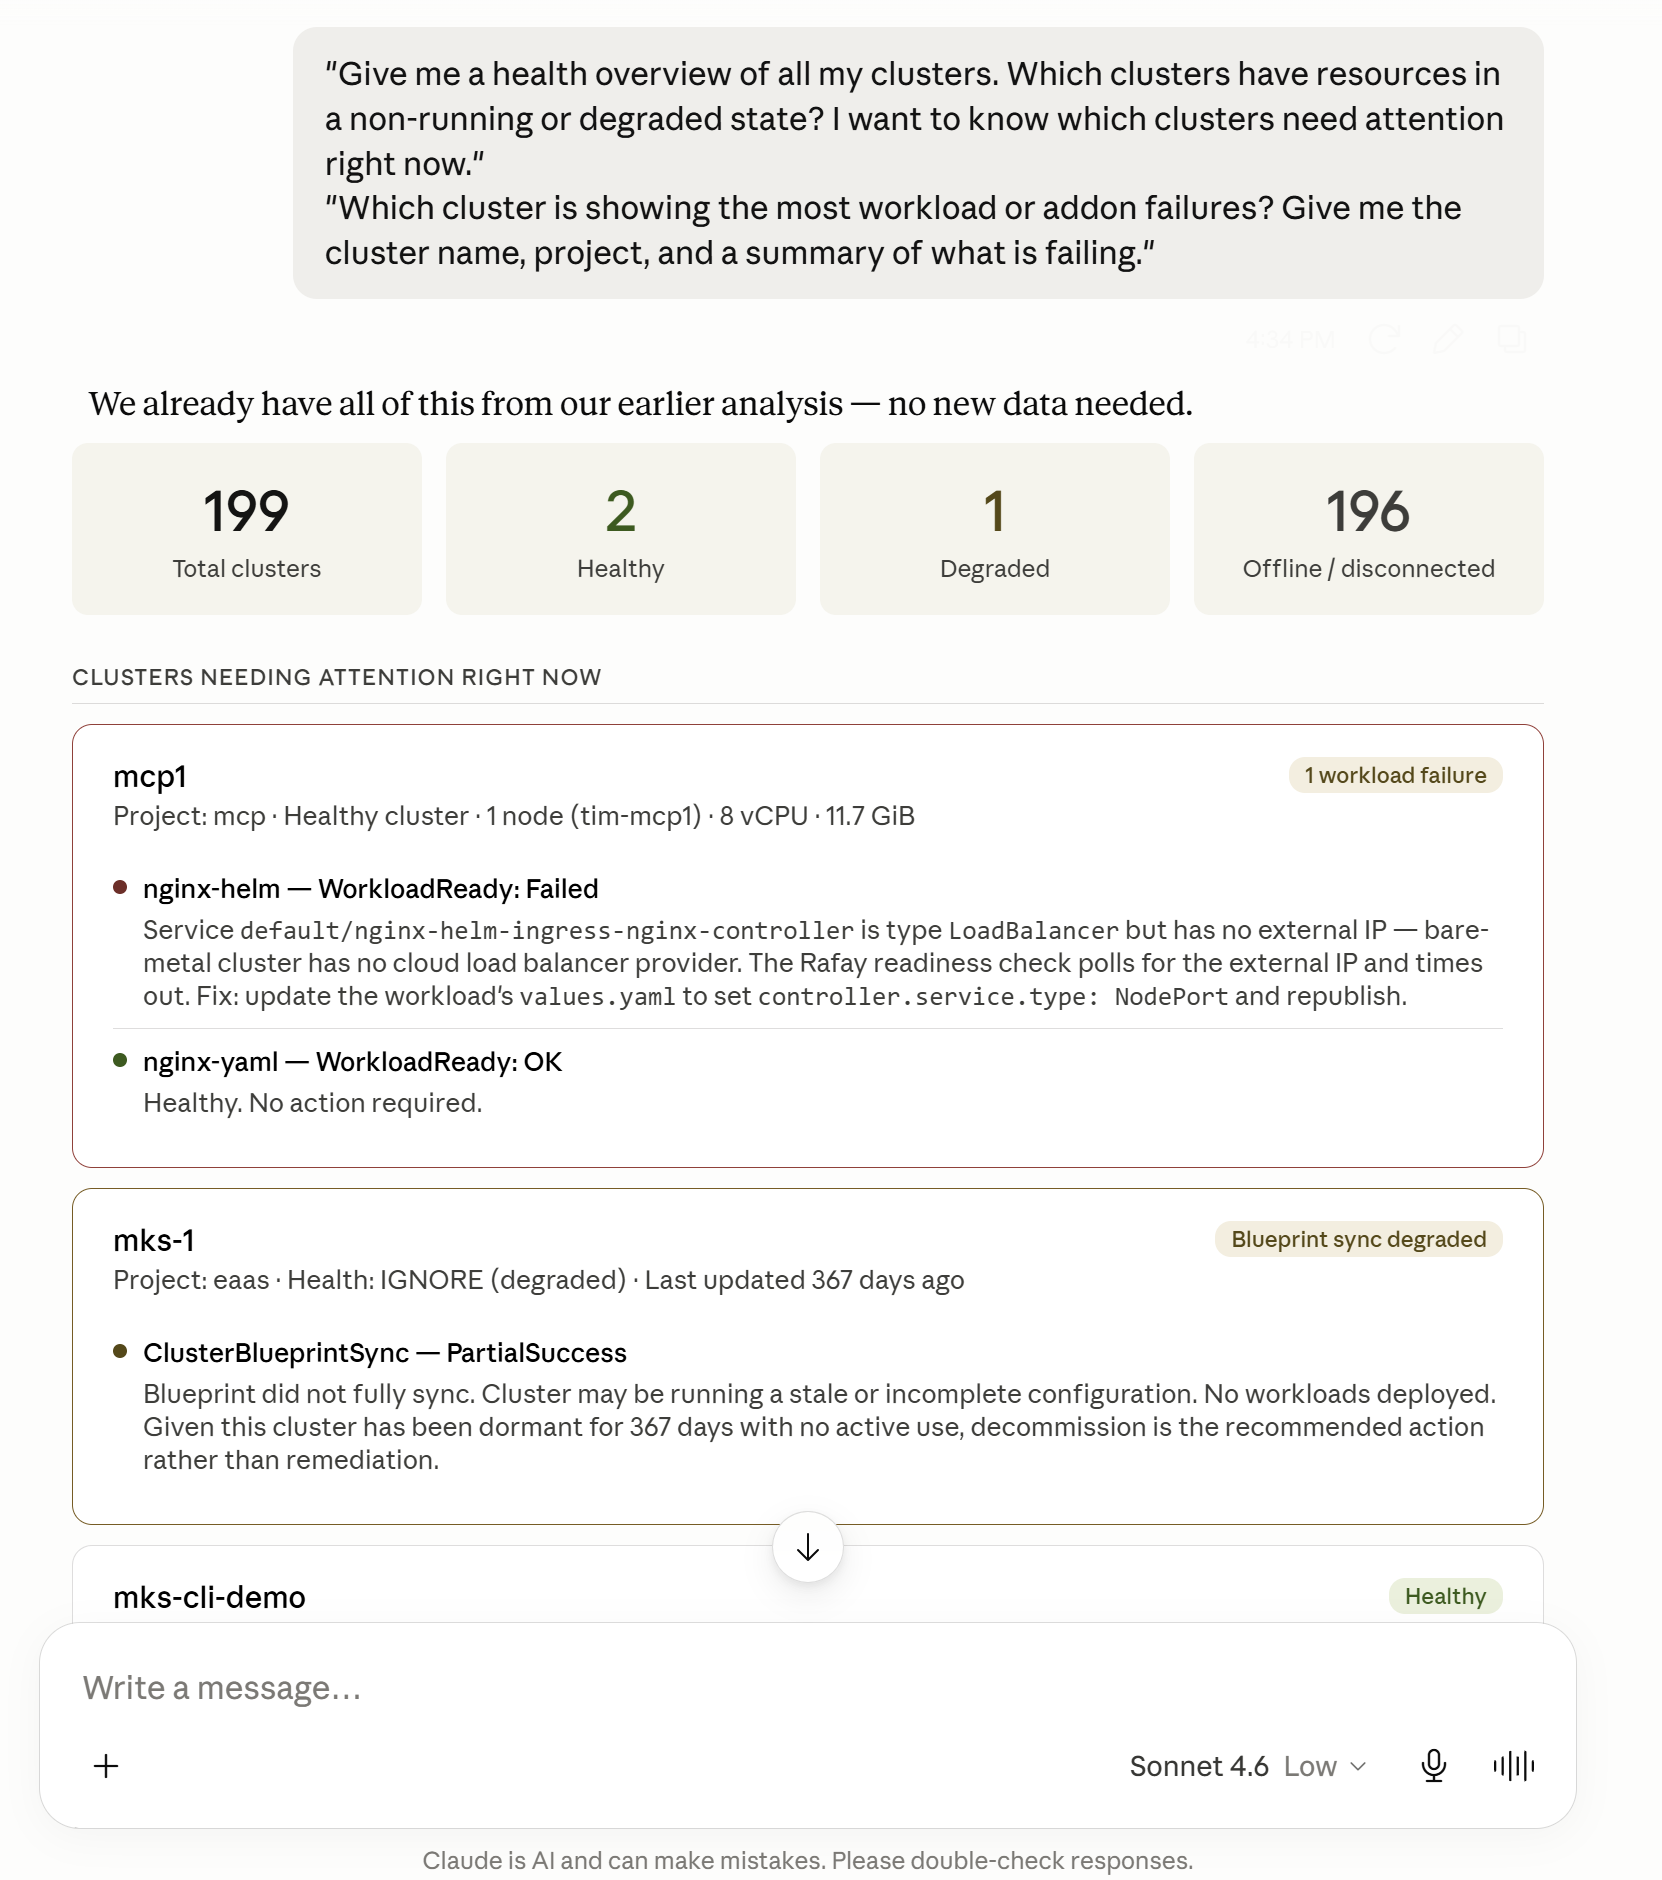
"Give me a health overview of all my clusters. Which clusters have resources in a non-running or degraded state? I want to know which clusters need attention right now."
"Which cluster is showing the most workload or addon failures? Give me the cluster name, project, and a summary of what is failing."
Step 3 — Cluster-Level Discovery
Drill into the problem cluster to surface all affected resources:
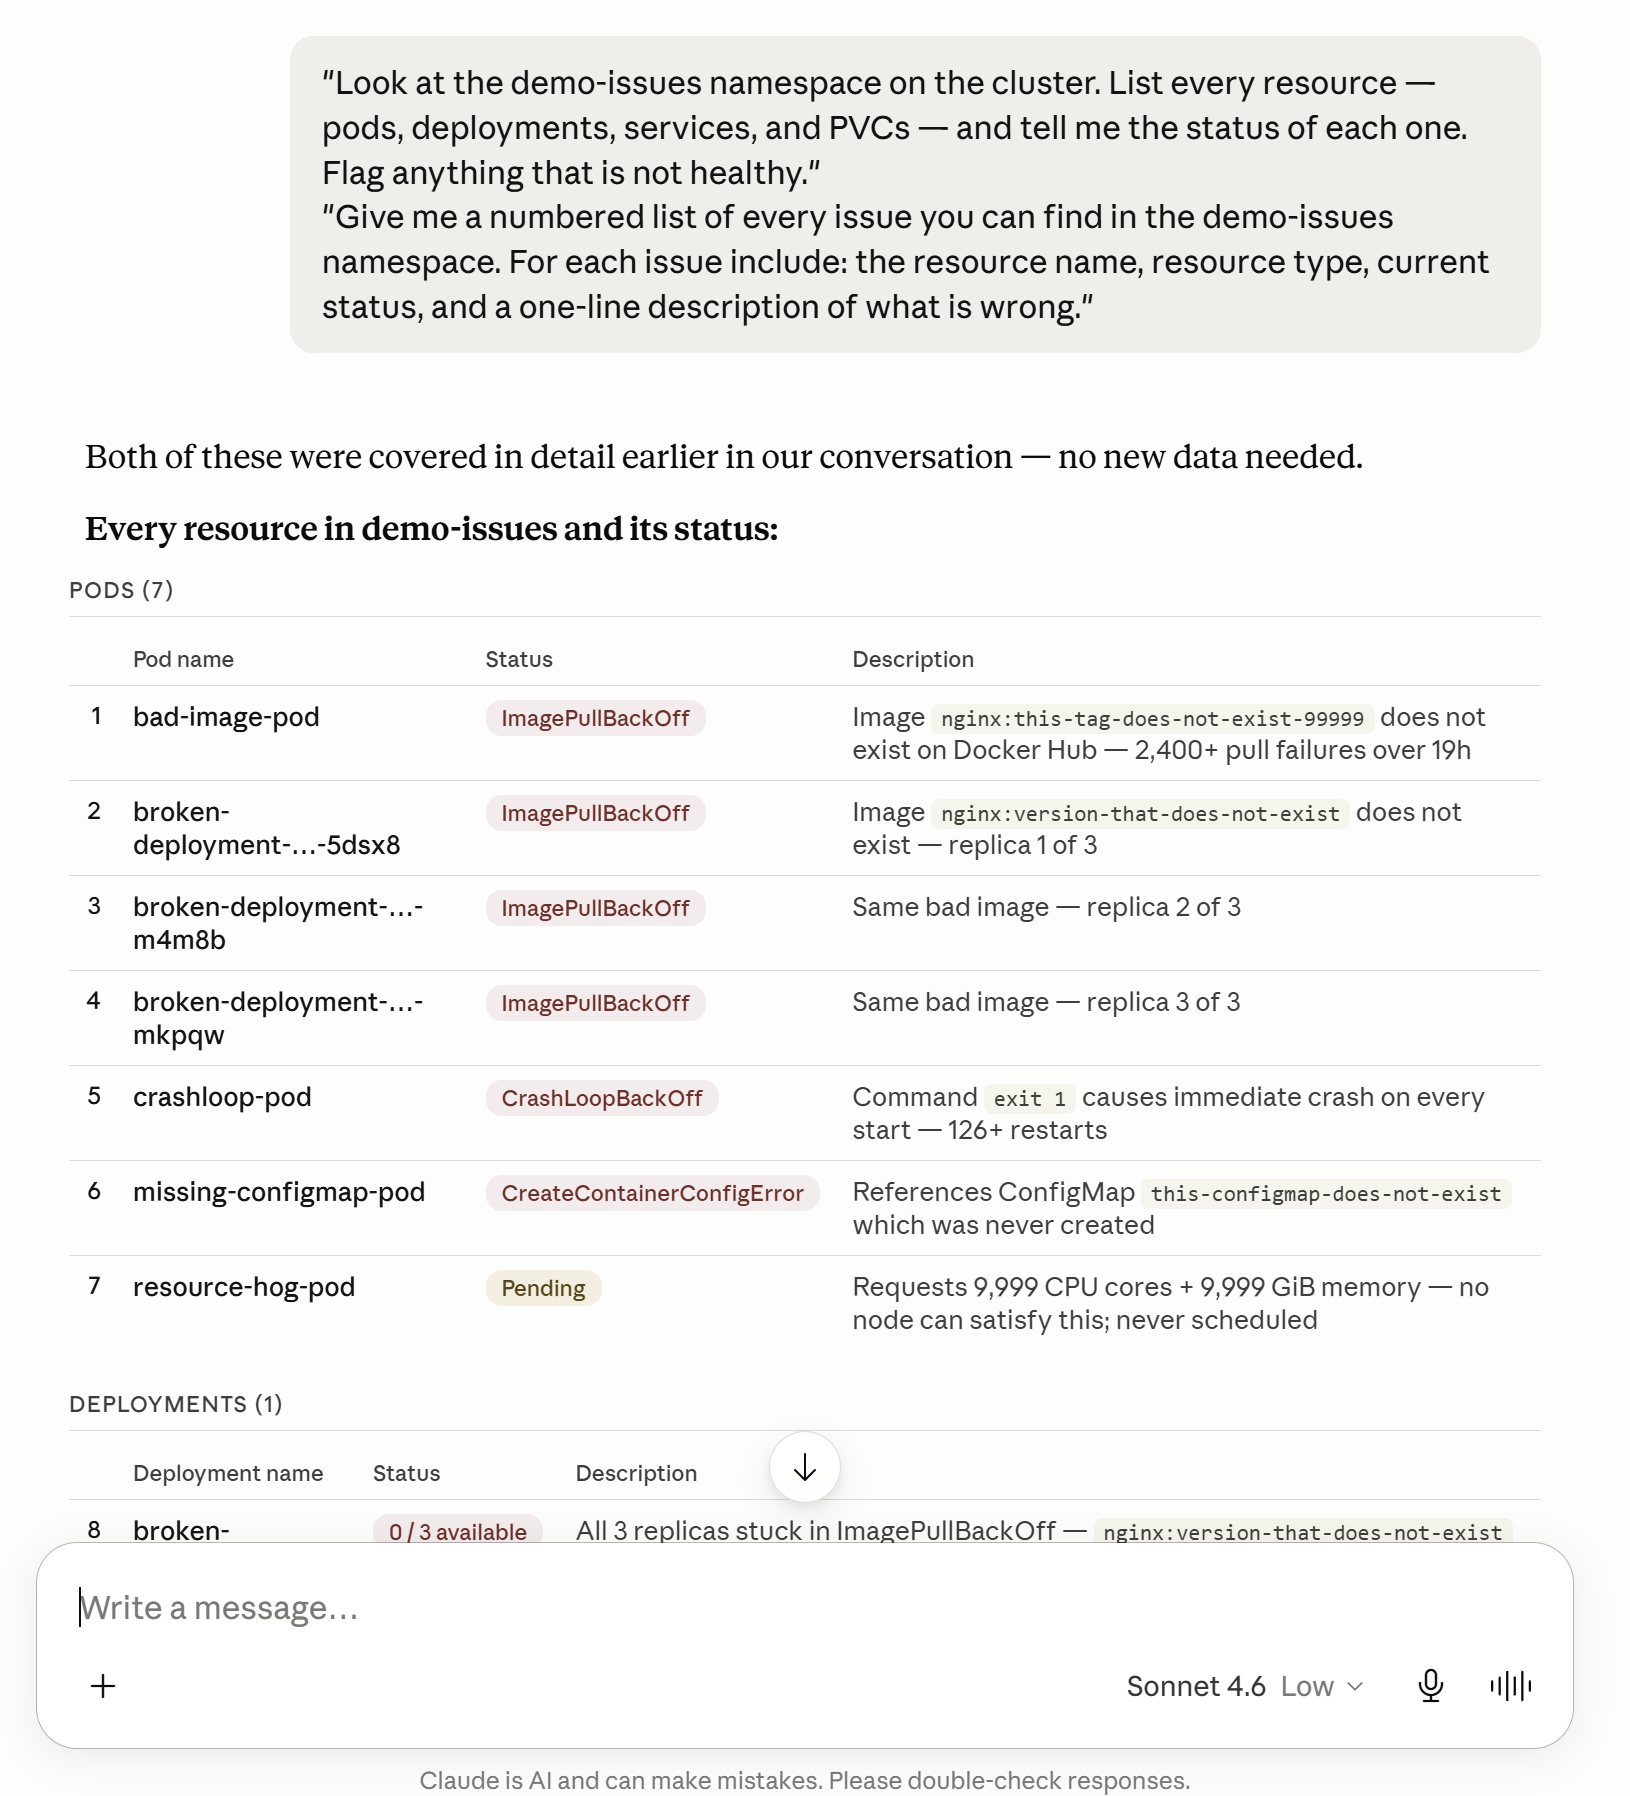
"Look at the demo-issues namespace on the cluster. List every resource — pods, deployments, services, and PVCs — and tell me the status of each one. Flag anything that is not healthy."
"Give me a numbered list of every issue you can find in the demo-issues namespace. For each issue include: the resource name, resource type, current status, and a one-line description of what is wrong."
Step 4 — Diagnose and Remediate
Work through each issue in the order surfaced by the server.
Issue 1 — ImagePullBackOff
"The pod bad-image-pod is in ImagePullBackOff. What does this error mean, what is causing it, and what is the exact fix I need to apply?"
Fix:
kubectl delete pod bad-image-pod -n demo-issues
kubectl run bad-image-pod --image=nginx:latest -n demo-issues
Issue 2 — Pending Pod
"The pod resource-hog-pod has been Pending. What is preventing it from being scheduled, and what are my options to fix it?"
Fix:
kubectl delete pod resource-hog-pod -n demo-issues
kubectl run resource-hog-pod --image=nginx:latest \
  --requests='cpu=100m,memory=256Mi' \
  --limits='cpu=500m,memory=512Mi' \
  -n demo-issues
Issue 3 — CrashLoopBackOff
"The pod crashloop-pod is in CrashLoopBackOff. What am I looking for in the logs, and what is the fix?"
Fix:
kubectl logs crashloop-pod -n demo-issues --previous

kubectl delete pod crashloop-pod -n demo-issues
kubectl apply -f - <<EOF
apiVersion: v1
kind: Pod
metadata:
  name: crashloop-pod
  namespace: demo-issues
spec:
  containers:
  - name: app
    image: busybox
    command: ["sh", "-c", "sleep 3600"]
  restartPolicy: Always
EOF
Issue 4 — Deployment with 0 Available Replicas
"The deployment broken-deployment shows 0/3 replicas available. What is wrong and how do I fix it without deleting the deployment?"
Fix:
kubectl set image deployment/broken-deployment app=nginx:latest -n demo-issues
kubectl rollout status deployment/broken-deployment -n demo-issues
Issue 5 — Service with No Endpoints
"The service no-endpoints-service has no endpoints. What does this mean for any application trying to reach it, and how do I fix it?"
Fix:
kubectl get pods -n demo-issues --show-labels

kubectl patch service no-endpoints-service -n demo-issues \
  --type='json' \
  -p='[{"op":"replace","path":"/spec/selector/app","value":"broken-app"}]'

kubectl get endpoints no-endpoints-service -n demo-issues
Issue 6 — Missing ConfigMap
"The pod missing-configmap-pod is in CreateContainerConfigError. What is causing this and what is the fastest way to fix it?"
Fix:
kubectl create configmap this-configmap-does-not-exist \
  -n demo-issues \
  --from-literal=APP_ENV=production \
  --from-literal=LOG_LEVEL=info

kubectl get pod missing-configmap-pod -n demo-issues -w
Issue 7 — Unbound PVC
"The PVC unbound-pvc has been in Pending state. What is causing this and how do I resolve it?"
Fix:
kubectl get storageclasses

kubectl delete pvc unbound-pvc -n demo-issues

kubectl apply -f - <<EOF
apiVersion: v1
kind: PersistentVolumeClaim
metadata:
  name: unbound-pvc
  namespace: demo-issues
spec:
  accessModes:
    - ReadWriteOnce
  storageClassName: standard
  resources:
    requests:
      storage: 10Gi
EOF
Conclusion
In this guide you used the Rafay MCP server to perform work that would typically require an operator to navigate multiple console screens, pull data from different sources, and manually assemble reports.
In Part 1 — Fleet Reporting, the MCP server queried the Rafay platform API across all projects and clusters in a single conversation to:
- Produce a complete fleet inventory with health status, blueprint versions, and last-updated timestamps
- Surface underutilized and unhealthy clusters without opening the Rafay console
- Identify consolidation candidates by correlating workload counts, regions, and project boundaries
- Calculate real infrastructure cost by pulling actual node specs and applying per-resource cost rates
- Generate a ranked cost summary with cost-per-workload efficiency ratios ready to share with leadership
In Part 2 — Cluster Troubleshooting, the MCP server provided platform-level visibility to identify which clusters had problems and surfaced the affected workloads, allowing you to:
- Identify degraded clusters across the fleet with a single natural language query
- Drill into a specific namespace and retrieve a structured list of every broken resource
- Diagnose the root cause of seven distinct failure types through conversational prompts
- Apply targeted remediations for each issue without switching between tools
The Rafay MCP server compresses workflows that typically span multiple console sessions, CLI commands, and spreadsheets into a single Claude conversation — giving platform engineers, SREs, and infrastructure leads faster answers and more time to focus on higher-value work.